Forest Carbon Monitoring: A Dove’s-eye View of Global Forest Change
Authors: Christopher Anderson, David Marvin, & Maxwell Joseph
As world leaders discuss climate solutions at Summit of the Future and Climate Week NYC, Planet is proud to announce the release of Forest Carbon Monitoring, a new data product for mapping forest change at high resolution worldwide.
Built using data from Planet’s fleet of Doves—the largest constellation of Earth-imaging satellites in the world—Forest Carbon Monitoring provides timely, operational, near-tree-scale insights into global changes in canopy height, canopy cover, and aboveground carbon density.
This dataset delivers insights into forest change every quarter and is provided at PlanetScope’s native resolution—near 3m—resolving deforestation, degradation, and forest carbon dynamics with unprecedented detail. The initial release includes quarterly observations from December 2020 through June 21st, 2024, providing rolling and current insights into forest structure and carbon.

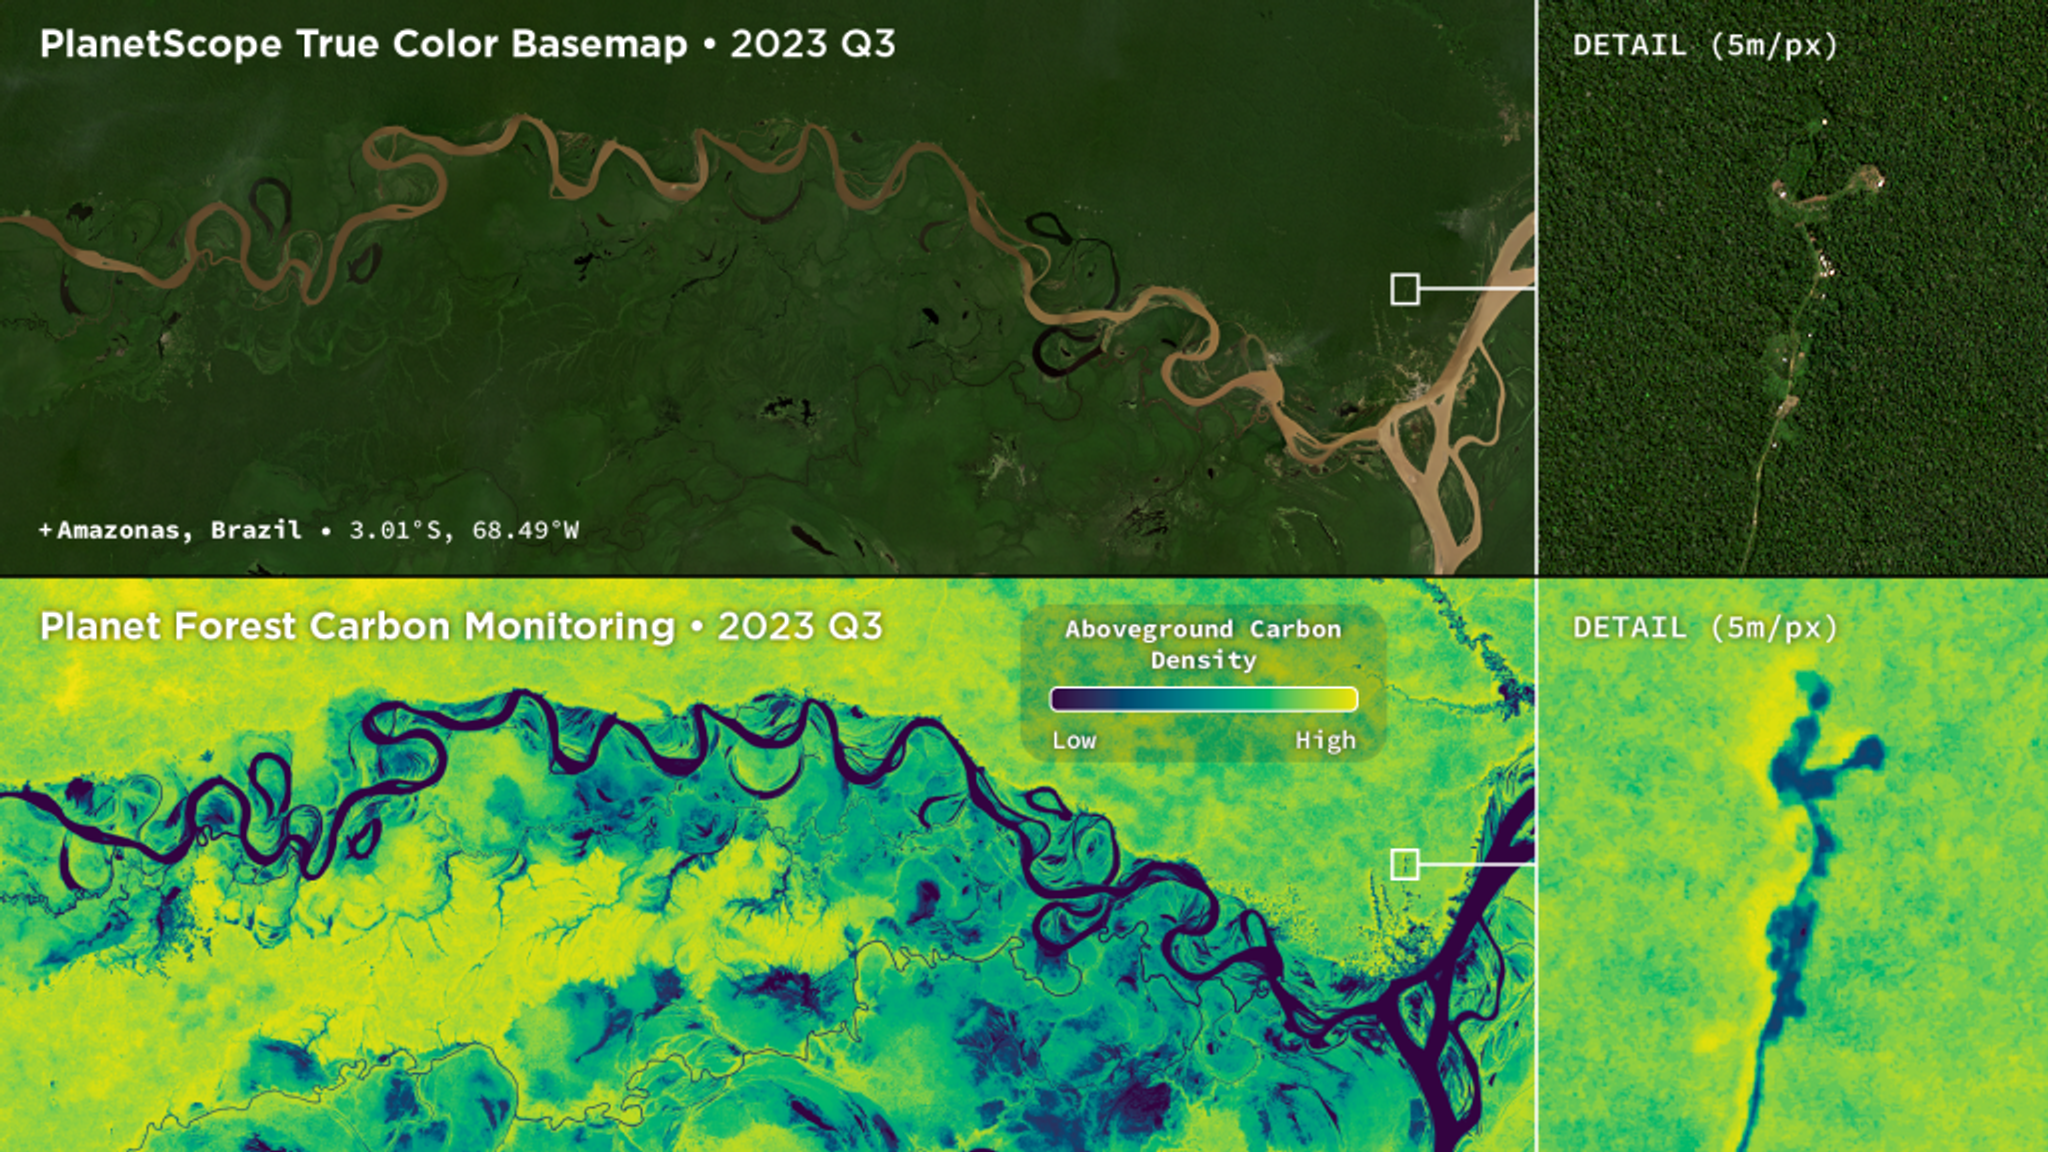
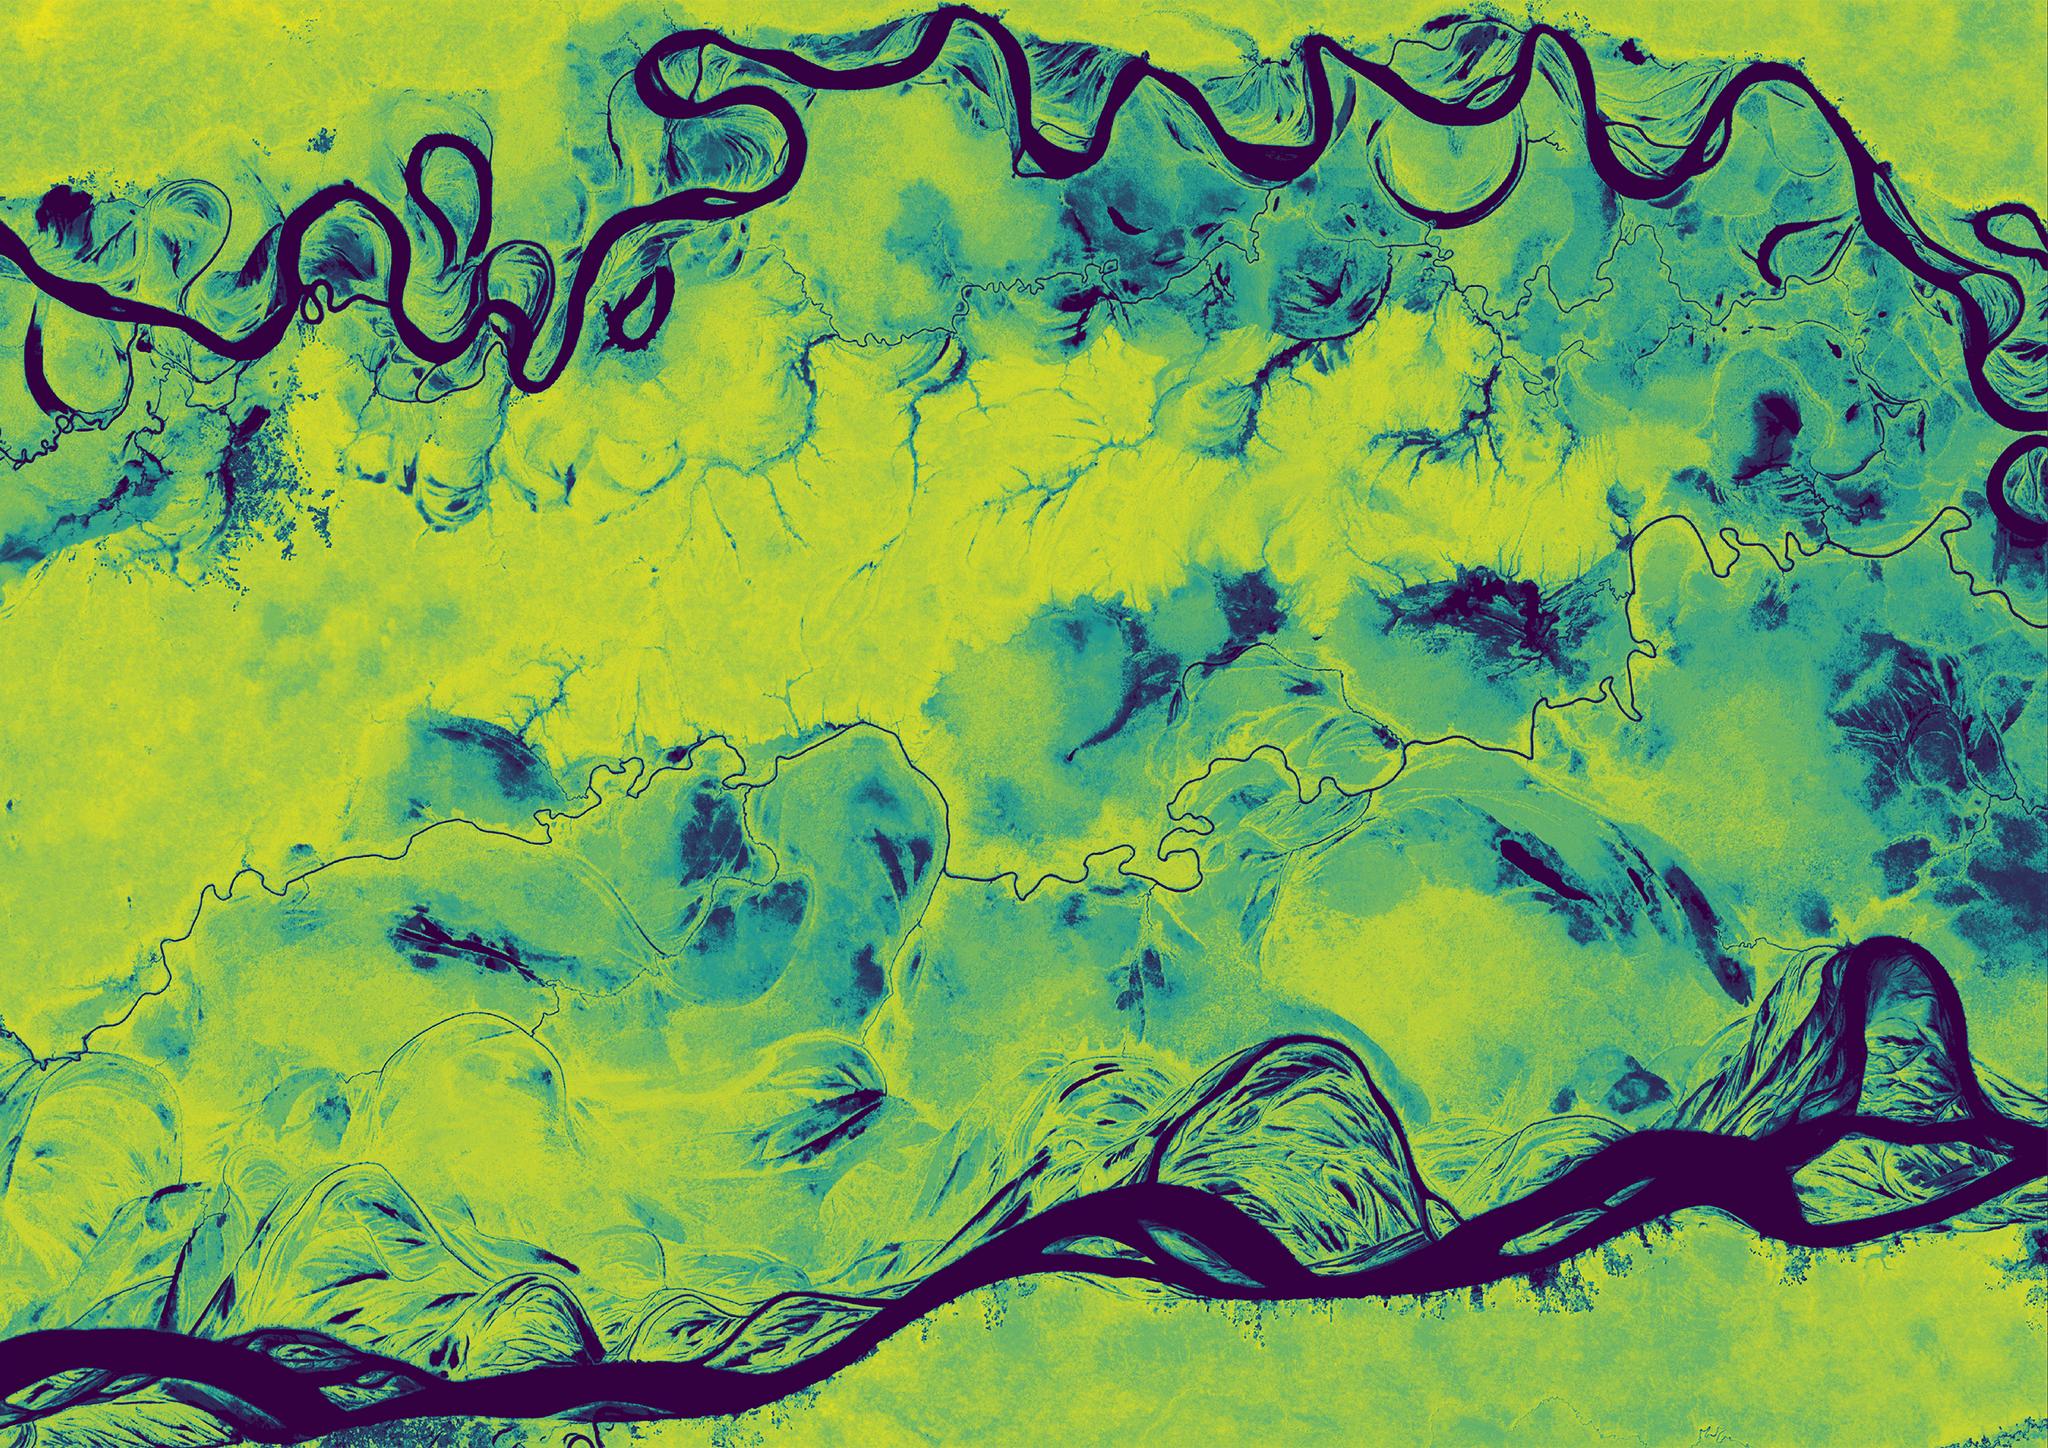
High resolution aboveground carbon density data along the Amazon River highlights the complex geography of carbon in tropical rainforests and captures detailed patterns of carbon losses at fine spatial scales.
Why is this dataset important right now?
Voluntary and jurisdictional carbon offset markets are navigating difficult but important questions around how to build trust among buyers, sellers, ratings agencies, regulators, local communities, and the public. And with EU Deforestation Regulation compliance slated to begin in December 2024, companies that source commodities—including soy, beef, palm oil, coffee, cocoa, and wood—will be required to assess, address, and mitigate deforestation risks in their supply chains.
Transparent, high-quality, regularly updated scientific data on deforestation and carbon storage are essential for markets and regulations alike to function and to flourish. Forest Carbon Monitoring was designed to support the monitoring, reporting, and verification needs of stakeholders across industries so they can spend less time navigating today’s fragmented data landscape and more time building the technical, financial, and regulatory systems that will underpin a more sustainable economy.
As world leaders meet this week, many are looking to chart pathways towards effective climate action. Of all climate solutions, carbon sequestration and storage by the biosphere provide huge mitigation potential, with forests offering the largest, cheapest, and most readily available set of solutions. Losing or slowing this pathway would be detrimental not only to climate efforts, but also to conservation and biodiversity initiatives around the world.
The release of Forest Carbon Monitoring marks the beginning of a new era in operational forest monitoring, and we look forward to supporting the wide array of government, commercial, and non-profit organizations working to build the next generation of natural climate solutions.

Canopy height data from eastern Victoria, Australia reveals detailed patterns of vegetation structure, contoured by terrain, hydrology, land use, and tree crowns themselves.
What use cases are supported?
Our customers and the broader scientific community can find many use cases, but we designed this dataset for project and jurisdictional monitoring, reporting, and verification of forest carbon stocks. The leading project type by volume in the voluntary carbon market continues to follow the REDD+ framework of avoiding deforestation of non-plantation forests, and our product excels at tracking deforestation and quantifying the resulting carbon losses.
The power of quarterly, 3m resolution data lies in detecting complex, diffuse phenomena like forest degradation and regrowth. Not all forest loss is uniform, making it crucial to map the selective harvest of individual or small groups of trees. Losing large, valuable trees can contribute to a significant loss of carbon, so tools to track deforestation need to deliver fine resolution to accurately account for carbon loss from this kind of forest degradation, especially for REDD+ projects. Working with coarser resolution data does not provide the same level of detail as Forest Carbon Monitoring does, which is adept at capturing these fine-scale changes. The long-sought ability to track such subtle change at global scale is now possible only with Planet’s satellite-powered Forest Carbon Monitoring.
A similar, long standing problem in remote sensing is detecting changes at early forest growth stages. Whether tracking natural regeneration or explicit interventions like reforestation, ARR (afforestation, reforestation, and restoration) projects generally rely on field site visits for monitoring. Forest Carbon Monitoring is sensitive to sapling and young tree growth, and can be combined with in situ data or data from other techniques to support digital monitoring, reporting, and verification, to improve quality and reduce costs.
Scaled up to sub-national or national scales, Forest Carbon Monitoring can also support jurisdictional carbon accounting, and policy implementations related to climate mitigation or adaptation.
Tracking reforestation progress with Forest Carbon Monitoring data can map tree growth over time across large areas.
What is the fine print?
Detailed technical validation that provides analytical guidance is forthcoming. Our team is committed to providing transparent, rigorous analyses using multiple independent datasets to provide detailed insights into the quality of our products. You can read about our intercomparison and validation methods for the Forest Carbon Diligence product to get a sense for how we approach these analyses. Since Forest Carbon Monitoring data are provided at such high spatial resolution and temporal frequency, we expect this product will be closely scrutinized. We would like to take this opportunity to address one key question we’ve received in anticipation of the launch.
Many tree crowns are larger than 3x3 meters - so what does 3m carbon even mean?
While structural metrics like canopy height and canopy cover are valid at nearly any spatial resolution, the finest observed unit of carbon stock measurement is typically the individual tree. Since tree structure varies greatly from individual to individual, partitioning the carbon stock of a tree into gridded, two-dimensional subunits may seem unrealistic. We thus consider 3m carbon to represent an emerging frontier in forest monitoring, and suggest that analysis of carbon data at the native resolution be carried out with caution.
The majority of use cases we aim to support involve aggregation over multiple pixels—like plots, stands, projects, or administrative units—which increases accuracy due to the "averaging out" of local noise. Based on ecological scaling theory, we expect very high levels of uncertainty at fine scales, with prediction accuracy increasing as carbon estimates are aggregated. There are other challenges related to interpreting pixel-level data— like pixel-level coregistration issues and image-to-image variability—that increase fine-scale uncertainty. We try to mitigate some of these issues by providing statistically calibrated, pixel-level prediction intervals to characterize these various sources of uncertainty and to avoid reporting overconfident estimates of change.
As a result, we encourage some form of aggregation to a higher spatiotemporal unit for analysis, and do not advise users to only analyze data at the pixel level. Aggregation will increase predictive accuracy, decrease uncertainty, and better align with standard ecological scales of carbon quantification.
Despite these caveats, predicting forest structural attributes at high resolution is important to capture fine-scale changes. Some signals are clearer at 3 meters than at 30 meters, such as the loss of individual trees, development of logging roads, or local variation in tree survival following disturbance. In addition, 3m data contains detailed spatial information that can be used to discriminate between plantation forests (e.g., single row plantations) from naturally growing forests.

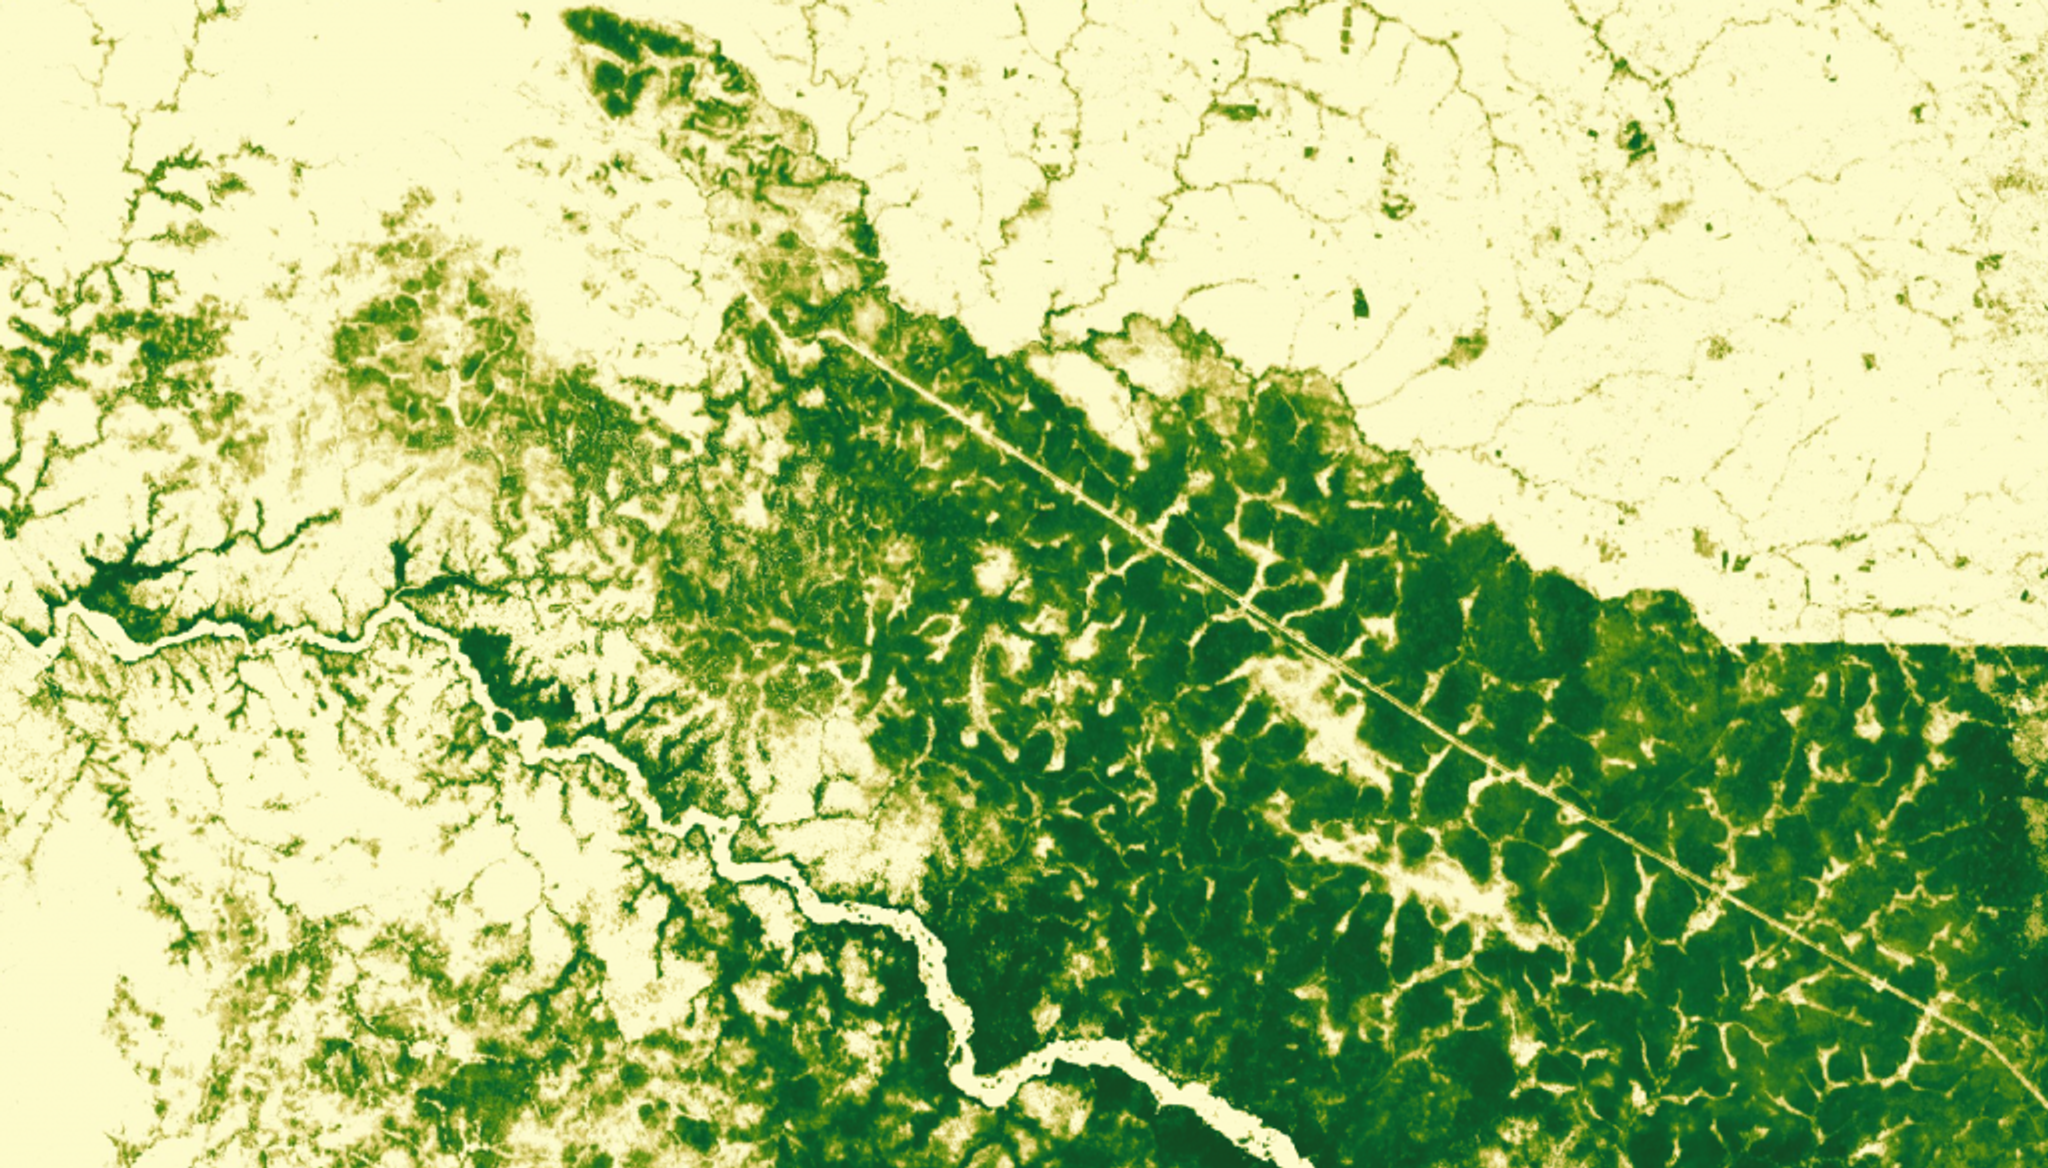
Canopy cover patterns at the border of Murchison Falls National Park, Uganda’s largest National Park.
On a personal note
Since Planet Co-Founder and CEO Will Marshall’s TED Talk in 2014, the opportunity to leverage Planet’s unique satellite constellation for global forest monitoring has been apparent. Salo Sciences was founded to build the world’s most advanced forest monitoring system to track the health of the biosphere, and it has been our privilege to join Planet and make our shared vision a reality.
It has been a long and complex path to realize this opportunity, but we are thrilled to share this release with you. We believe this is the most precise forest mapping data available, but we also acknowledge that it’s not perfect. There is more to improve and refine, and we look forward to working with our partners, users, and the scientific community to further advance our shared goals.
The conclusion of one journey marks the beginning of the next, just as the sprouting of a seed presages the growth of a tree.
Ad Sylvae

Ready to Get Started
Connect with a member of our Sales team. We'll help you find the right products and pricing for your needs


