From Satellite Data to Actionable Insights: Land Surface Temperature Based Tracking of Heatwaves and Urban Heat Island Effect: A Path to Cooler, Healthier Cities
Written by Maya Nolles, Yoann Malbeteau & Jasper Dijkstra
Heatwaves are becoming more frequent and intense worldwide, with cities bearing the brunt of extreme temperatures. Urban areas, densely packed with heat-retaining concrete and limited green space, are highly vulnerable to these heatwaves through the Urban Heat Island (UHI) effect. Tracking where and when heat builds up and how it spreads is critical for protecting urban populations. This article explores methods to assess the spatial distribution of heat risk during heatwave events using Planet’s unique Land Surface Temperature (LST) data, which captures continual and near-real-time observations at 1:30 a.m. and 1:30 p.m at both 1 km and 100 m resolution. Here, the 1 km LST archive acts as the “tip” to detect broad heatwave patterns, while its 100 m resolution data provides the “cue,” allowing for detailed spatial analysis of high-risk zones within cities.
Understanding Heatwaves as Temperature Anomalies
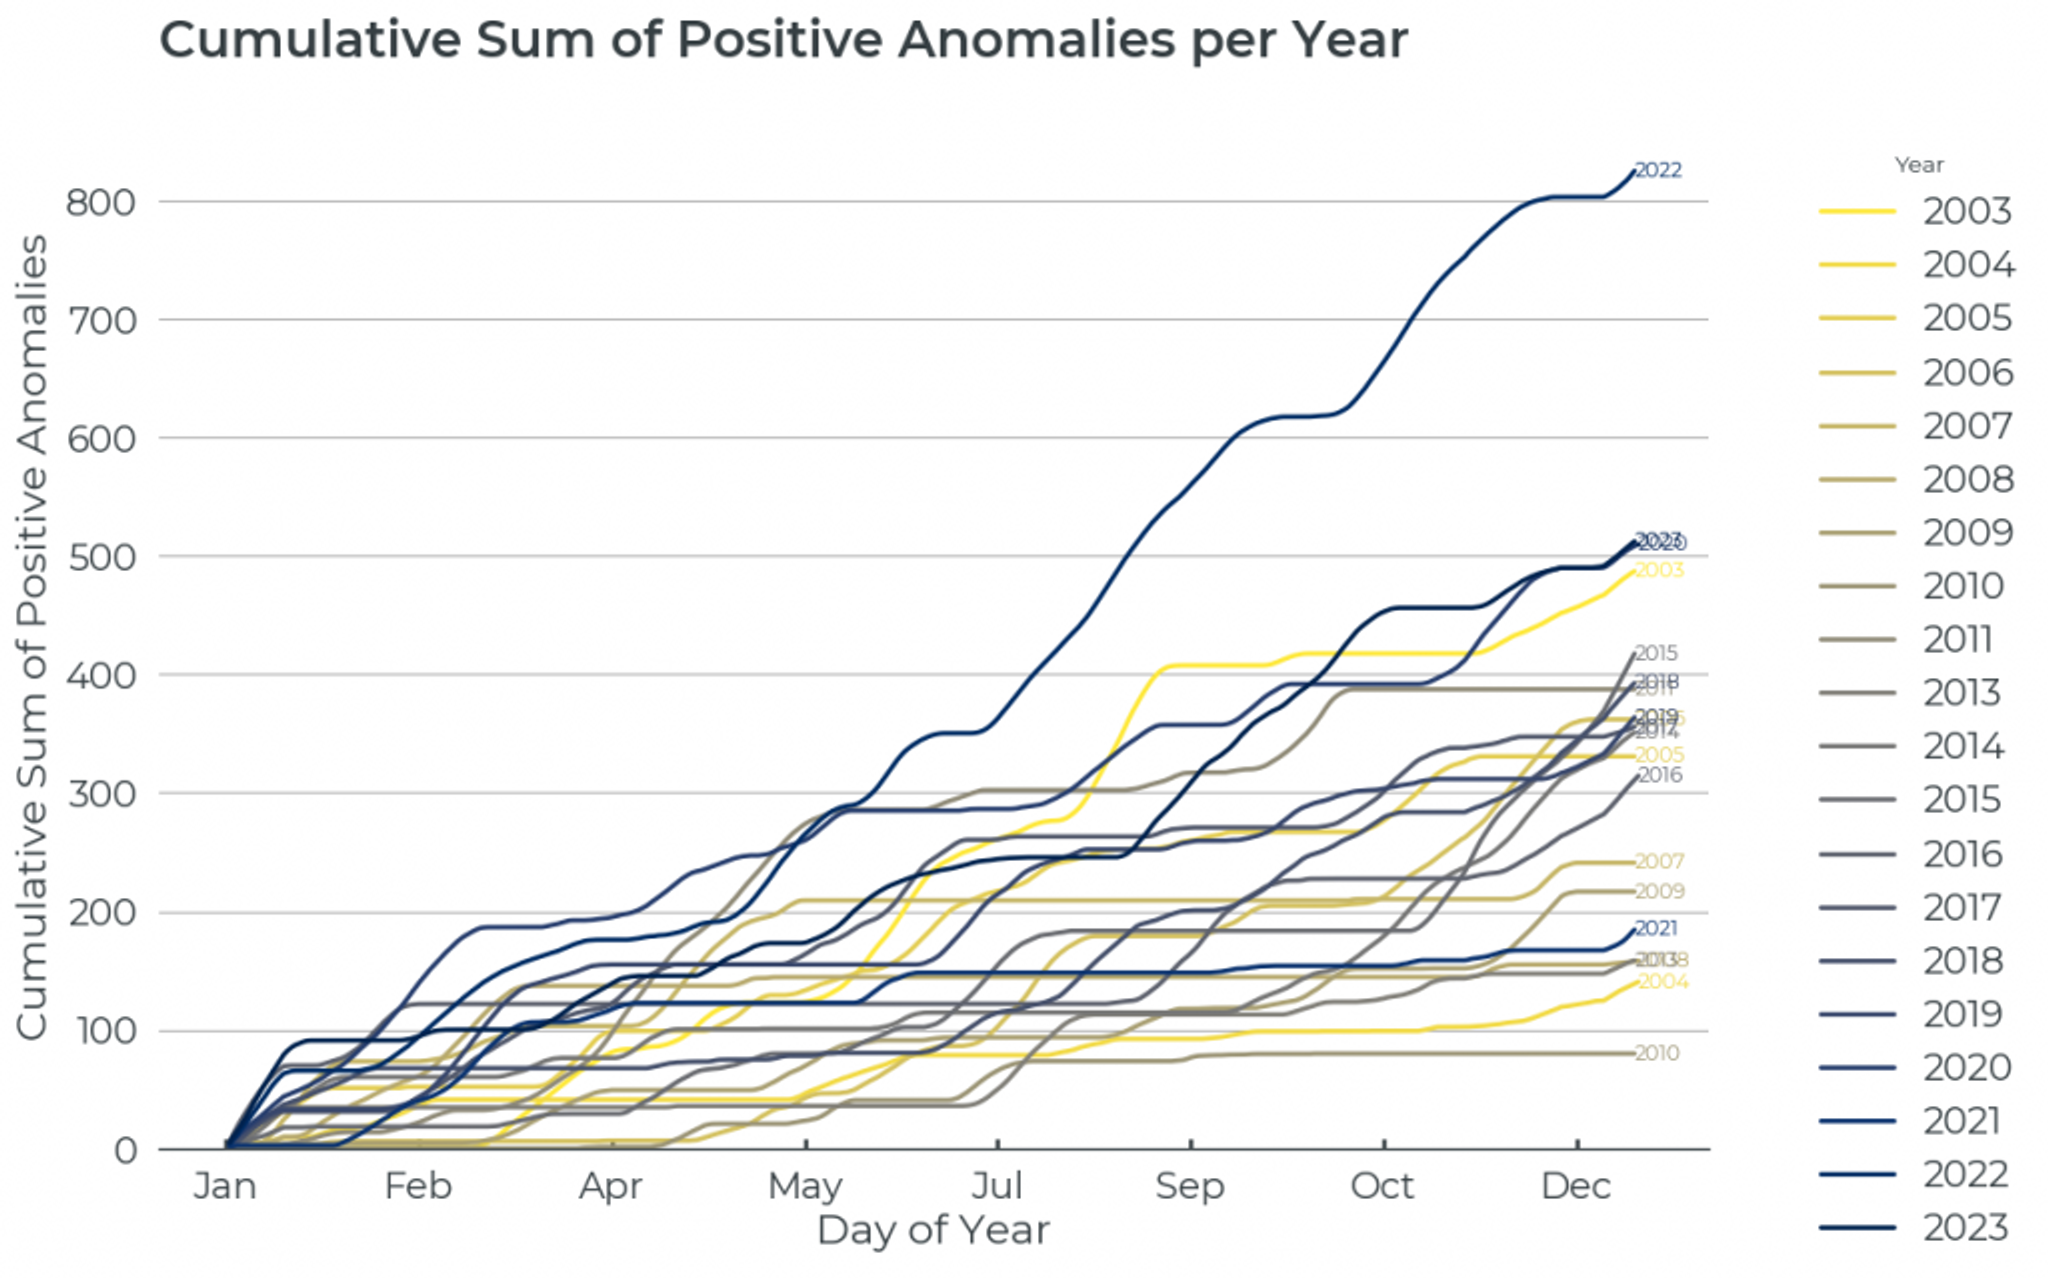
By tracking positive temperature anomalies relative to the climatology - the historical temperature average - at a 1 km resolution for the last 20 years, we can identify and visualize periods when the heat exceeds typical levels. Cumulative positive anomalies highlight the intensity and duration of extreme heat events over time, where high values can suggest heatwave conditions.

Fig. 1 Cumulative sum of daily positive anomalies per year over Bordeaux.
Heatwaves can be seen as periods of very strong positive temperature anomalies, but there’s no universal method for defining a heatwave. One approach, however, is the method of Nairn & Fawcett (2014), which identifies heatwaves by examining temperature peaks and their duration within the climatology of the study area. Thus, even in generally colder cities, any significant temperature anomaly or unusual spike can still pose a serious risk to public health. Nairn & Fawcett use the Excess Heat Factor (EHF) to determine the strength of a heatwave, by multiplying the deviation of the three day average from the climatology with the deviation of the recent temperature from the preceding thirty days. This multiplication of two temperature differences results in a unit of °C², which emphasizes periods where both the intensity and persistence of heatwaves are elevated and allows better identification of high-risk heatwave events.

Fig. 2 Heatwaves over Bordeaux from 2002 to 2023 determined by the EHF.
The Urban Heat Island Effect: Why Cities Feel the Heat
The UHI effect explains why cities experience significantly higher temperatures than surrounding rural areas. This effect arises due to factors such as high building density, reduced green spaces, and extensive paved surfaces, which trap and radiate heat back into the environment. During a heatwave, UHIs amplify the already intense temperatures, creating "hot spots" within cities. Studying the spatial distribution of heat during these events helps reveal which areas in cities are most vulnerable, guiding mitigation strategies.
Estimating Heatwave Impact with Land Surface Temperature Data
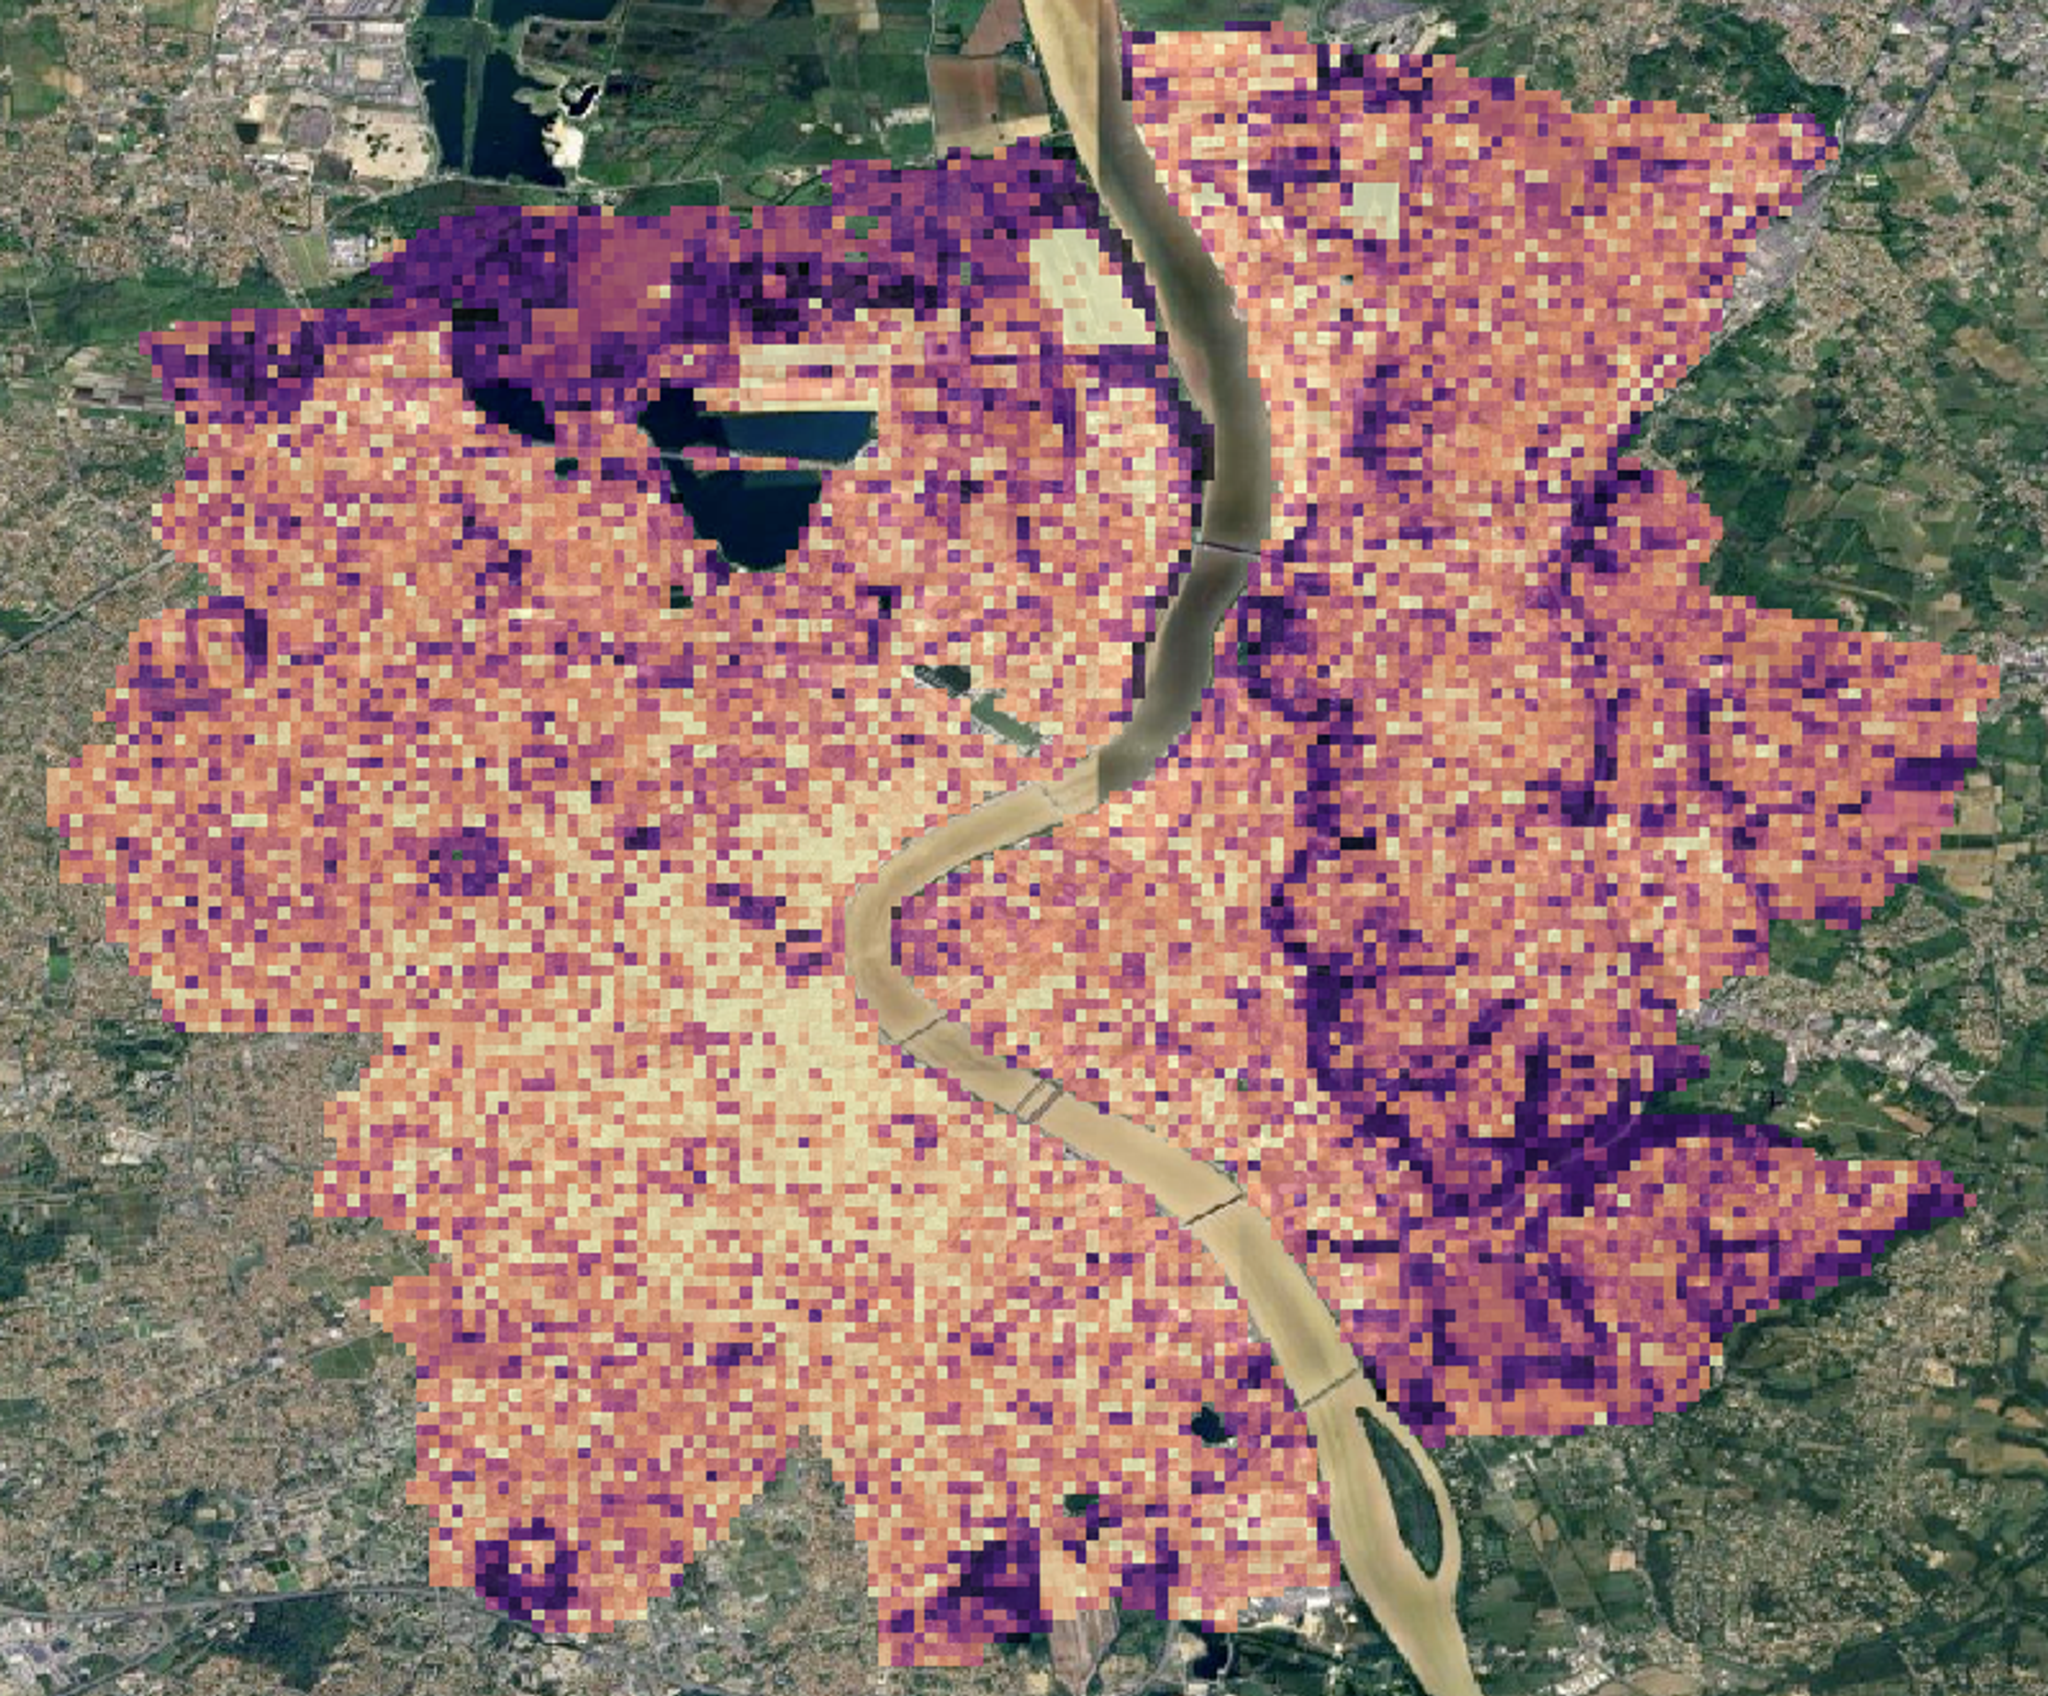
Leveraging Planet's cloud-free high resolution LST data, we can quantify the cumulative positive anomaly for each city pixel. This cumulative anomaly identifies regions within the city that experience the greatest heat intensity over time, offering a clear view of where the UHI effect is strongest.
This process involves several steps:
- Data Collection: Collect 20 years historical 1 km temperature data to determine average temperatures (climatology) for the region.
- Anomaly Calculation: Calculate 100 m daily temperature anomalies by comparing observed temperatures with its climatology.
- Cumulative Analysis: Add up positive anomalies over the course of the identified heatwave to highlight areas with sustained high temperatures.
The result is a detailed spatial map showing the cumulative temperature anomaly for specific heatwaves.

Fig. 3. Spatial distribution of positive heat accumulation over Bordeaux.
Addressing Urban Heat Islands to Promote Climate and Public Health Goals
Mitigating the UHI effect not only addresses climate resilience (UN Sustainable Goal (SDG) 13: Climate Action) but also promotes health and well-being (SDG 3: Good Health and Well-Being) by reducing the risks associated with high temperatures. Leveraging urban ecosystems and nature-based solutions – like enhancing green spaces, implementing blue-green infrastructure, and promoting sustainable urban design – helps reduce urban temperatures and improve air quality, strengthening the climate-nature nexus. Using nature to cool cities not only lowers health risks but also supports biodiversity and overall resilience against climate impacts.
High temperatures impact workforce productivity, especially in sectors involving outdoor or physically demanding labor. Heat stress not only reduces productivity but also increases health risks and strains healthcare resources. Furthermore, elevated temperatures worsen air quality by trapping particulate matter and nitrogen dioxide, intensifying respiratory and cardiovascular issues. By managing UHI, cities can enhance air quality, support healthier work environments, and ultimately improve residents' quality of life.
Therefore, incorporating Planet’s LST data to track heatwaves and the UHI effect can provide you a data-driven foundation for creating cooler, more resilient urban spaces, improving public health, and fostering sustainable urban development.
Try This Analysis Yourself
Interested in exploring the impact of heatwaves and the UHI effect? Sign up for a 30-day free trial of the Planet Insights Platform and access Land Surface Temperature data used in this blog. Follow along with the steps in our Python Notebook and start analyzing heatwave impacts on urban areas today.
Sources
Nairn, J. R., & Fawcett, R. J. B. (2014). The excess heat factor: a metric for heatwave intensity and its use in classifying heatwave severity. International Journal of Environmental Research and Public Health, 12(1), 227–253. https://doi.org/10.3390/ijerph120100227

Ready to Get Started
Connect with a member of our Sales team. We'll help you find the right products and pricing for your needs.

