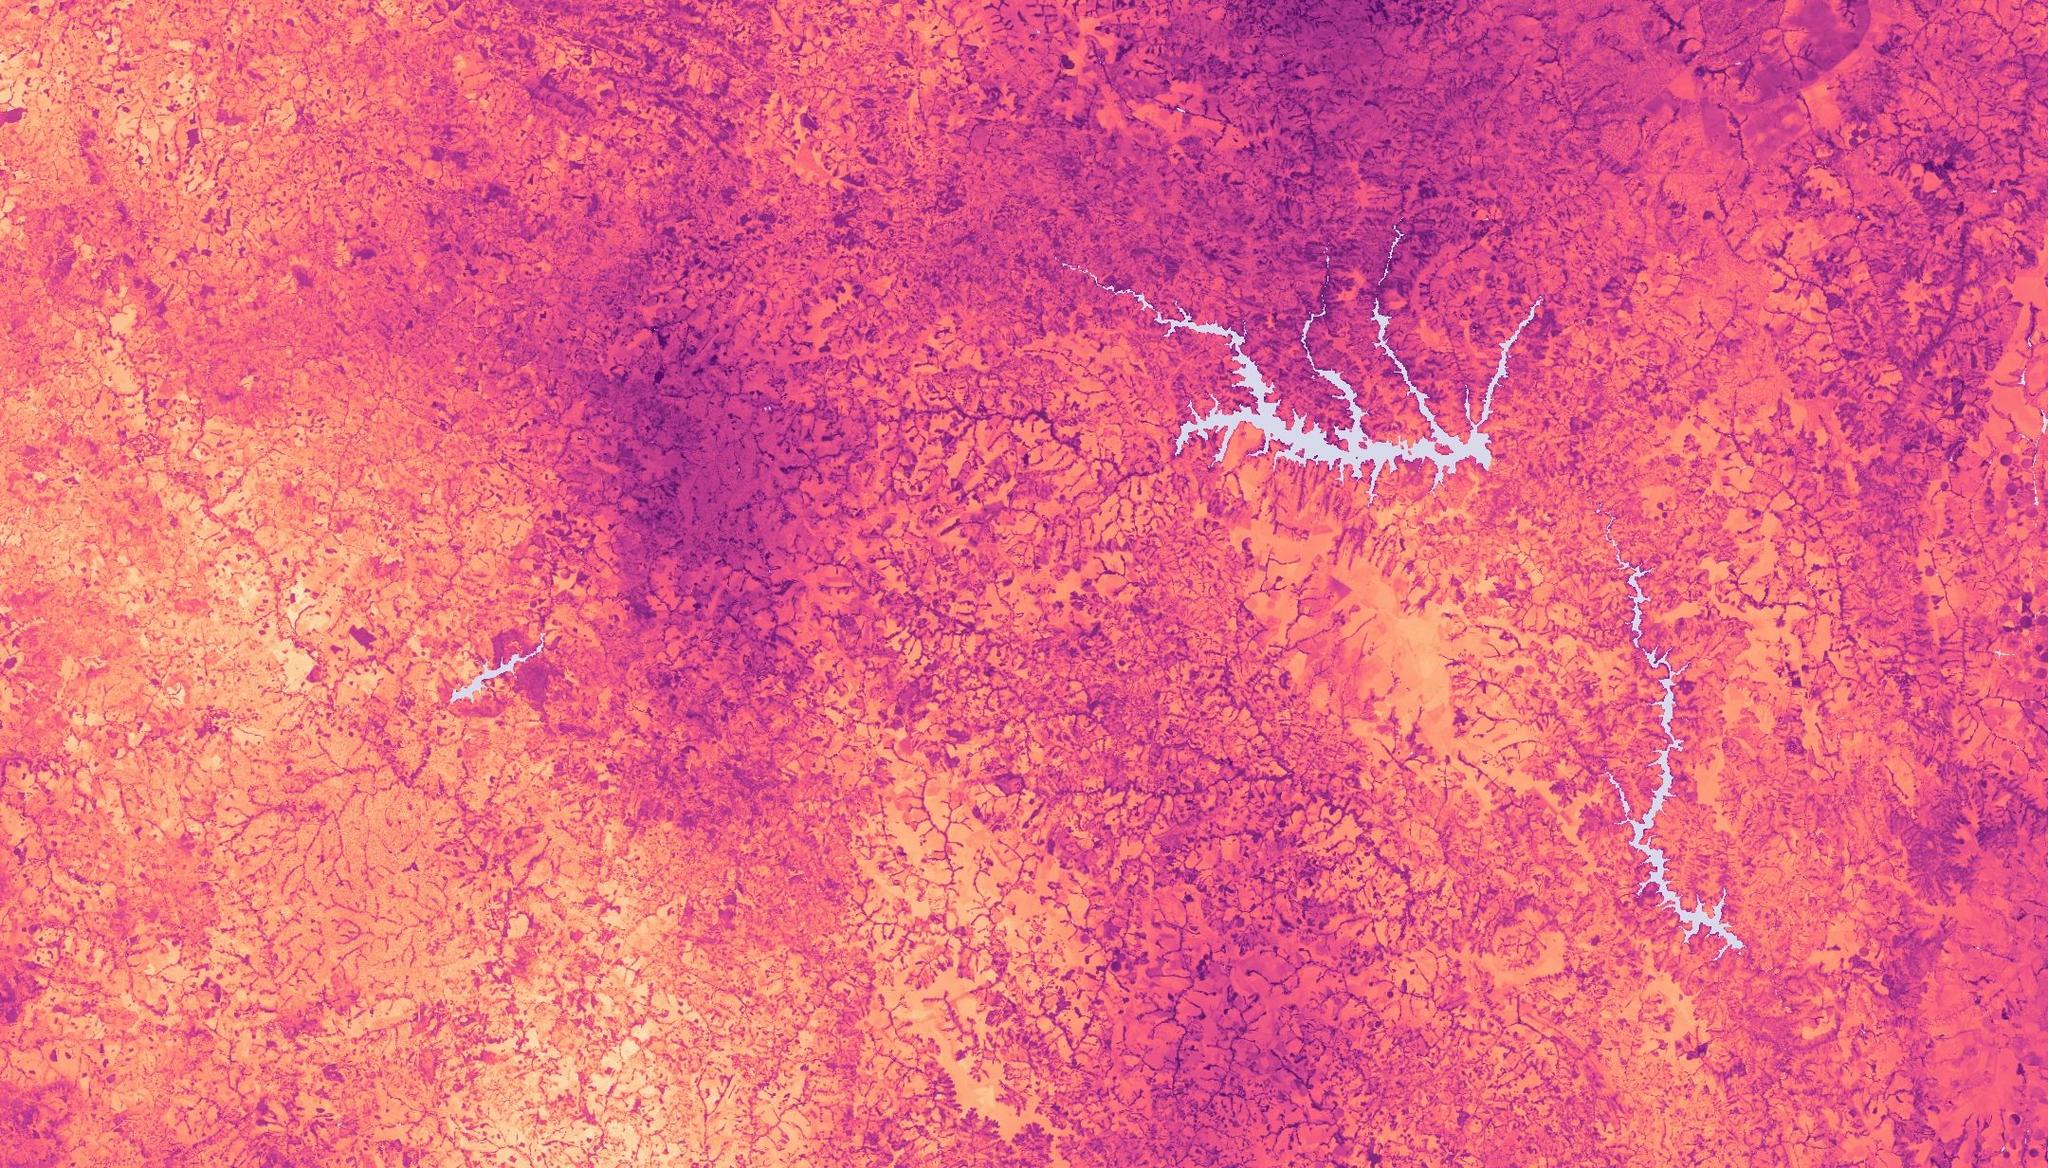
Satellite-Based Land Surface Temperature for Deriving Growing Degree Days
Learn how to calculate Growing Degree Days to optimize crop management and enhance growth modeling.
Authors: Maddie Grady and Annett Wania
Accurately tracking crop growth stages is vital for optimizing agricultural practices. Temperature has a significant impact on crop growth rates, and an effective way to quantify this is through growing degree days (GDD) or thermal time. In this article, we'll explore how to calculate GDD using Planet Land Surface Temperature.
GDD measures the accumulated temperature over the growing season by adding up the daily average temperatures that exceed a certain base threshold necessary for crop growth. This can be used to infer crop growth stages. For example, 800 GDD accumulated from the planting means that the crop should be flowering. This provides farmers with valuable insights into crop development, enabling them to make smarter management choices, like applying crop protection products or fertilization in optimal windows.
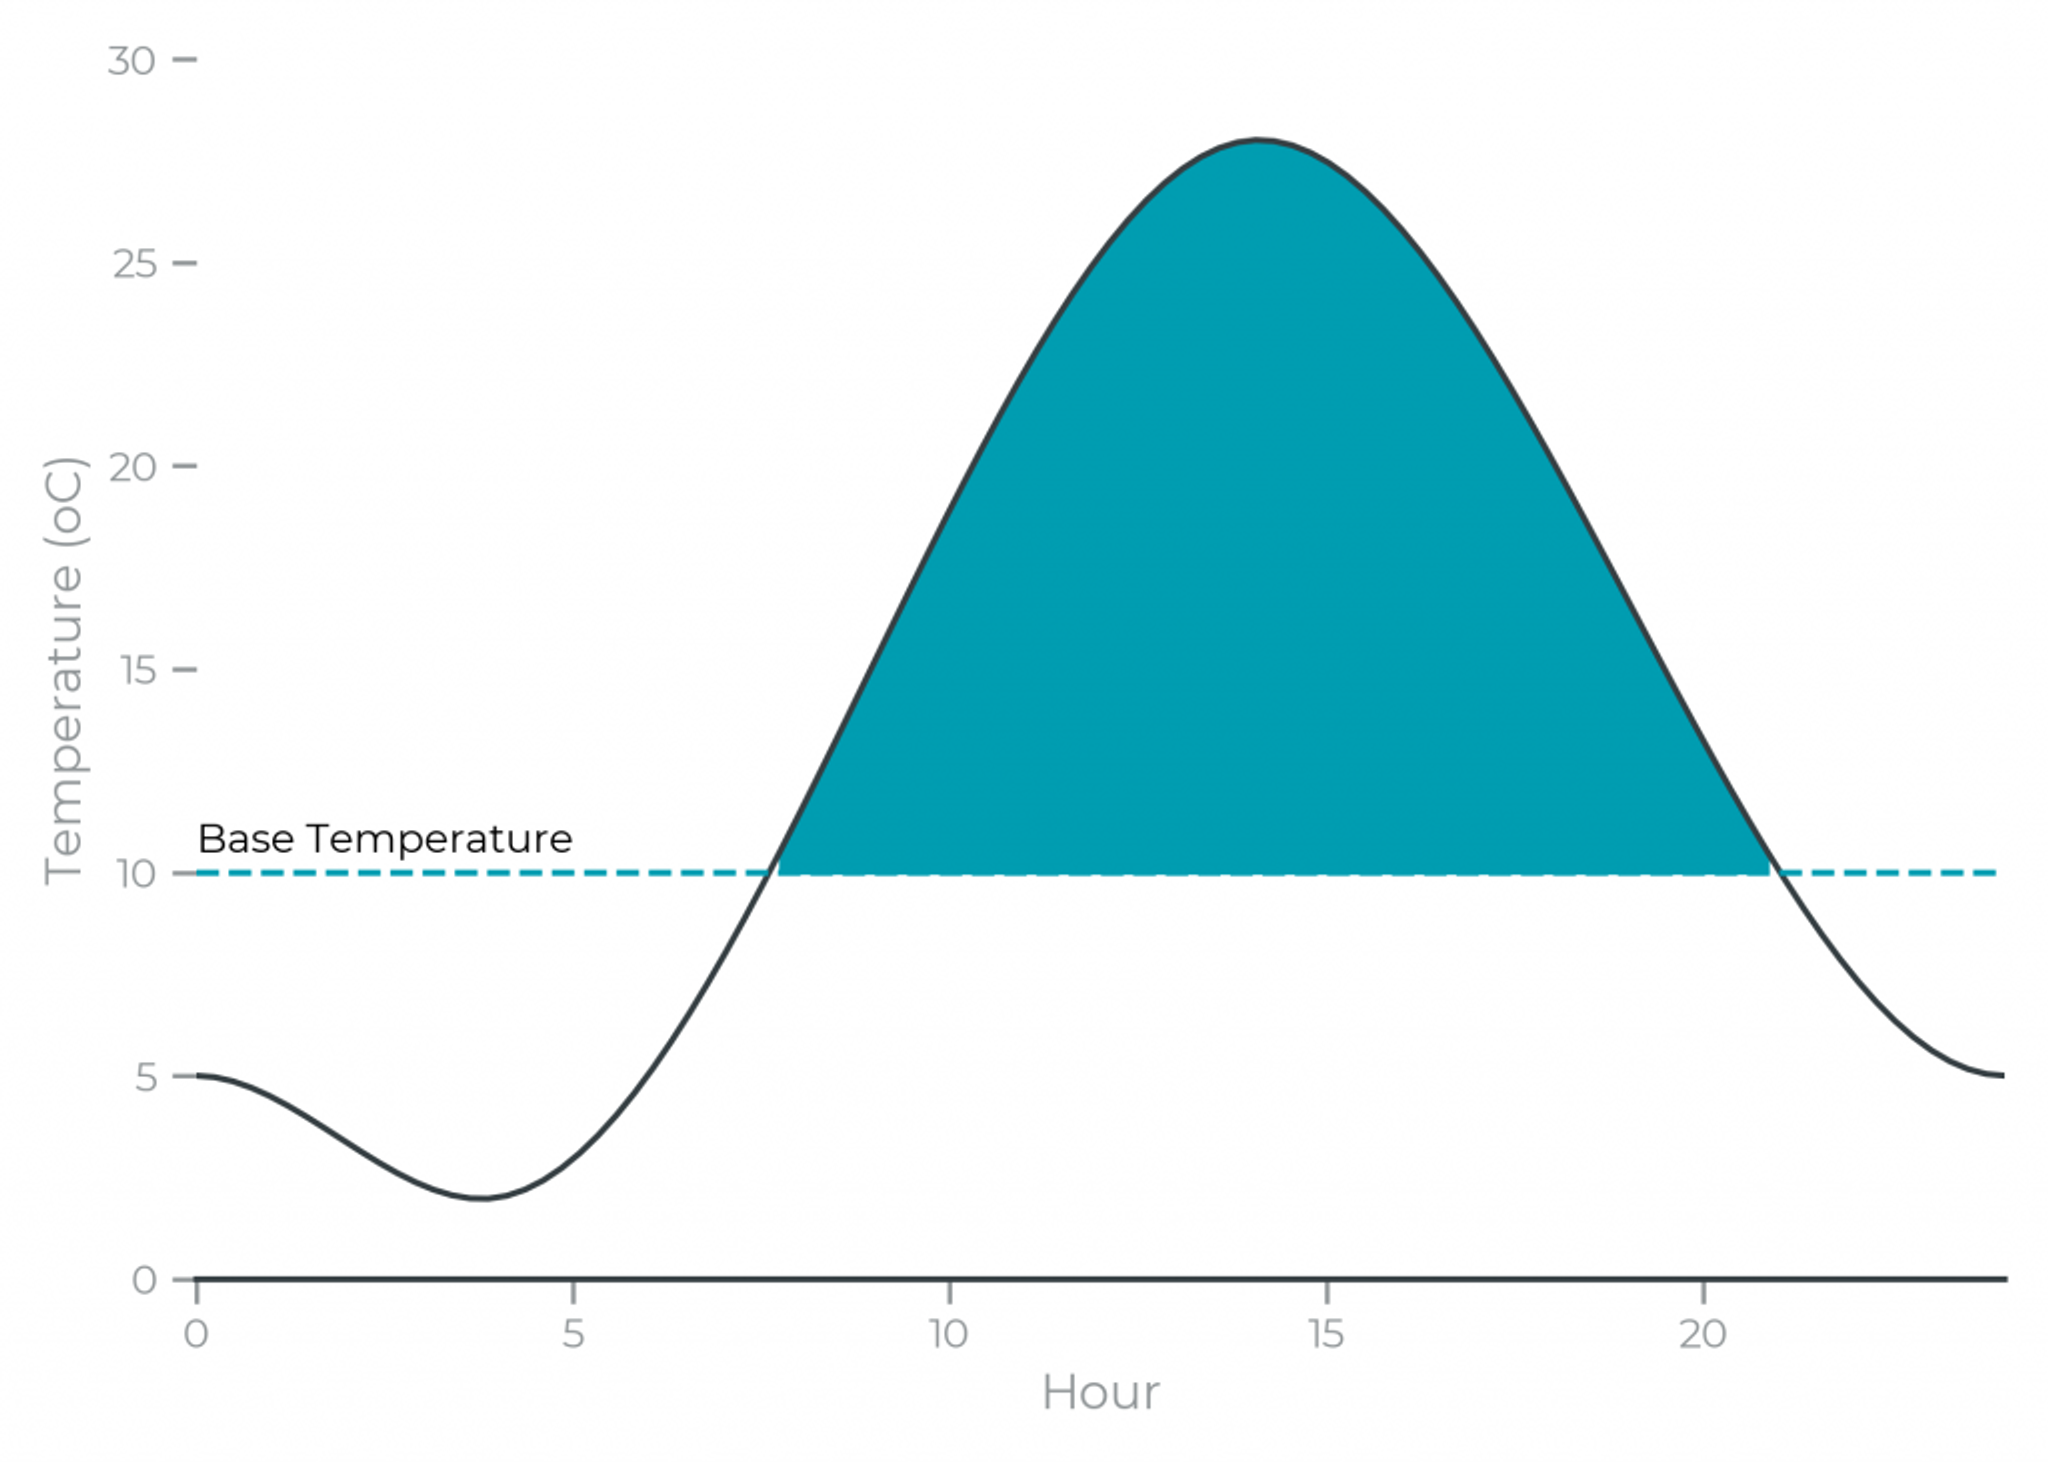
Graphical representation of GDD. The area in blue indicates the time where there is sufficient thermal energy for growth to occur.
Calculating GDD usually relies on air temperature data from weather stations. However, satellite-derived Land Surface Temperature (LST) offers an alternative data source that can improve on weather station data for two reasons:
- The 100 m spatial resolution captures field level variations missed by meteorological data that measures a single point. LST can capture more granular, field-level temperature fluctuations that might arise from microclimatic conditions in a given area.
- Weather stations measure air temperature 2 m above the surface. Although a strong proxy for available thermal energy, surface temperature may serve as an alternative representation of the thermal energy available to the crops. Integrating surface temperature data into thermal time calculations could enhance the accuracy of crop growth modeling, by measuring the surface temperature directly, rather than relying on correlation between air and surface temperatures.
Calculating Growing Degree Days From Land Surface Temperature
There are two inputs needed to calculate GDD:
- Daily maximum and minimum temperatures to calculate the average temperature.
- A crop specific development threshold to identify the temperature range for crop development.
LST acquisitions occur at 13:30 (1:30 p.m. local time) in the day and 01:30 (1:30 a.m. local time) at night. Although these times roughly align with daily minimum and maximum temperature, they don't match the exact timings needed to calculate the daily average temperature. To address this, daily temperature extremes were modeled using LST day and night acquisitions and air temperature in hourly measurements by the United States Climate Reference Network (USCRN), achieving an r2 of 0.72 for minimum temperature and 0.82 for maximum temperature.
The development threshold is crop specific. In this example, commonly used local crop development thresholds for air temperature were applied. The daily average temperature (calculated from the daily minimum and maximum) is adjusted to represent the available thermal energy for crop growth, by subtracting the crop development threshold. This value is then cumulatively summed from the start date (e.g. crop planting or emergence) to indicate the total temperature accumulation.
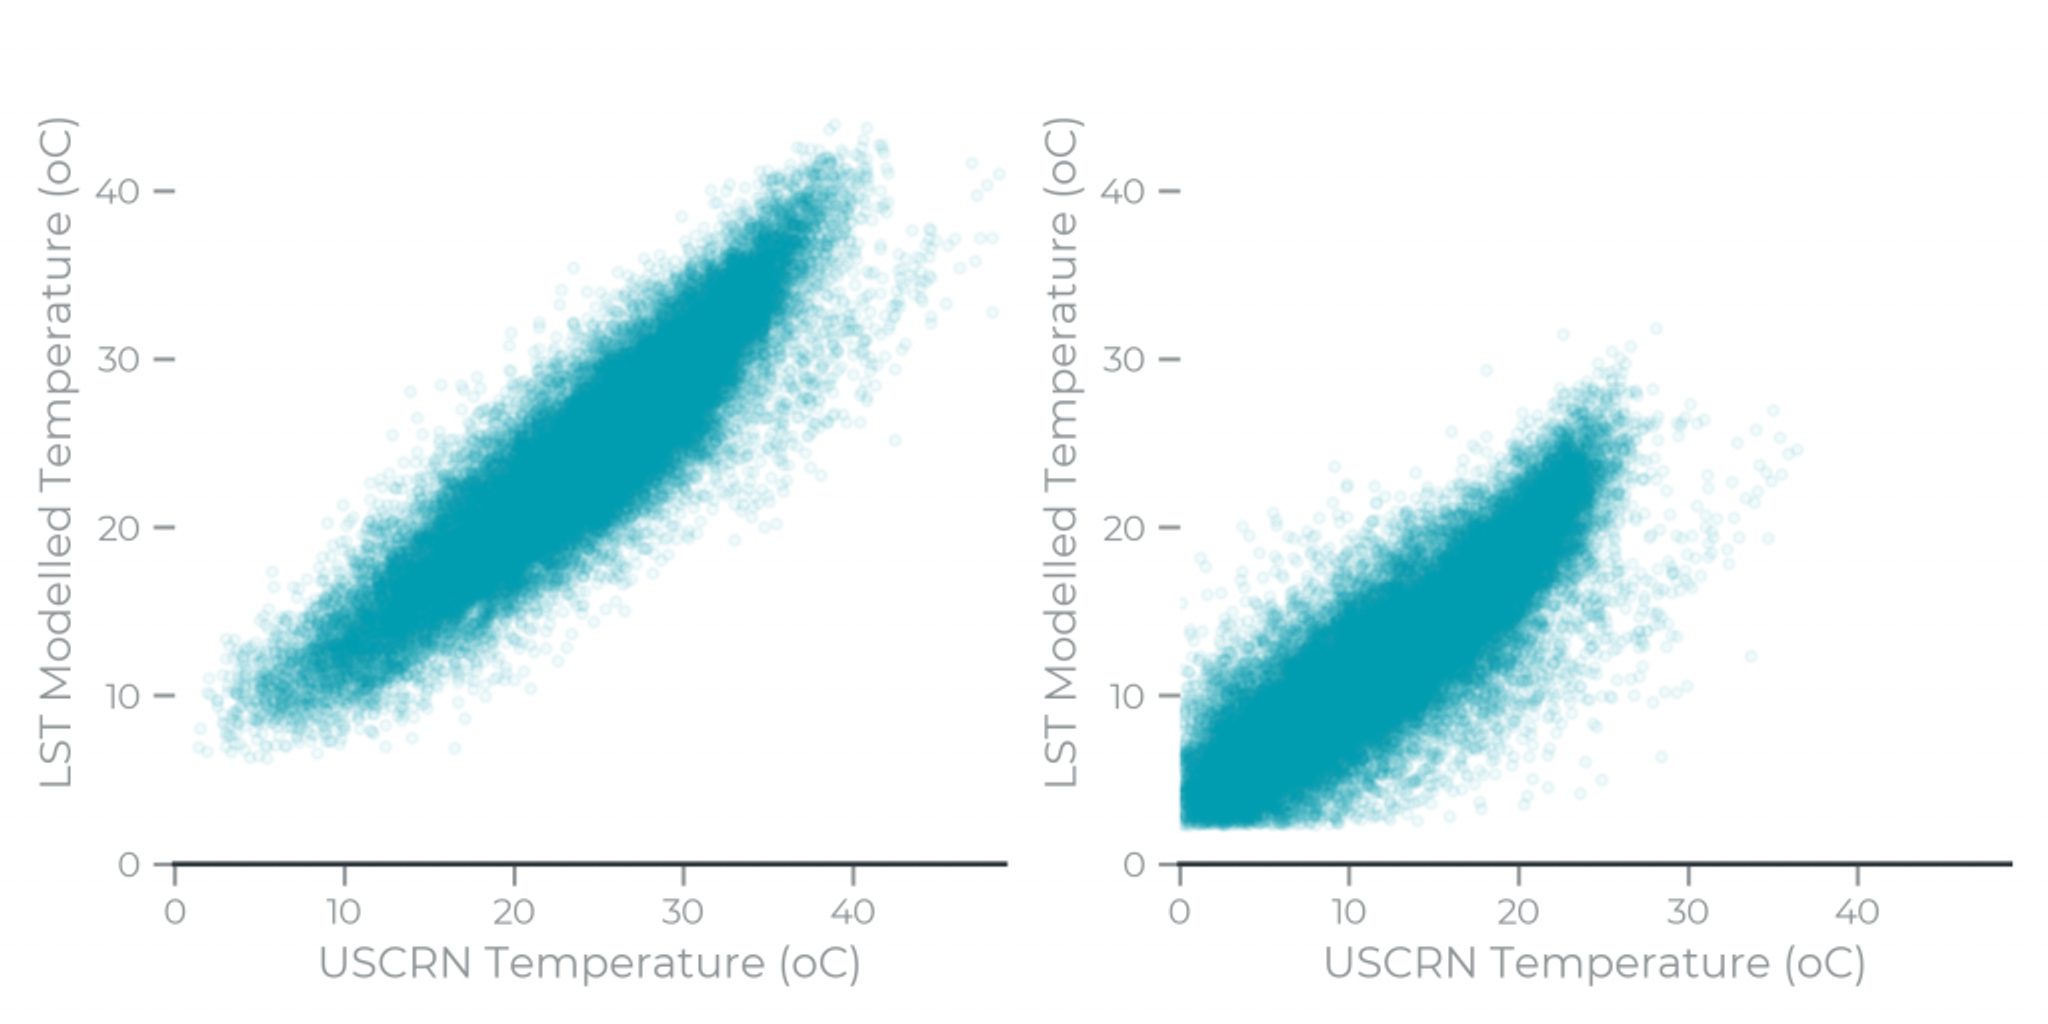
Scatter plot of LST modeled daily maximum (left) and daily minimum (right) air temperature for all USCRN stations and years (2013 - 2022).
Validation Against Weather Station Data
When crops reach the same phenological stage, it means they’ve received a similar amount of thermal energy for growth, so the cumulative thermal time should also be similar. For instance, if crops in Field 1 emerged on April 1 and flowered on May 15, while crops in Field 2 emerged on April 7 and flowered on May 18, the cumulative thermal time between these dates should be comparable. We compared LST-derived GDD to weather station GDD using crop growth records from the 2020–2023 growing seasons for multiple crops in Brandenburg, Germany and 208 fields from the 2017 growing season for maize in Kansas, U.S. Air temperature data for comparison was sourced from the local weather stations and cumulative GDD was computed from the visit date closest to crop emergence. We evaluated the quality of the GDD data by comparing it against crop development phases to ensure consistency across different years and locations.
Standard deviation in total cumulative GDD between the Kansas fields was 8.6% lower for LST-derived GDD than the weather station GDD. The graphs below illustrate how across multiple fields and growth seasons the accumulation of thermal time can be a consistent predictor of phenological development from LST. In these plots the crop growth stage and the cumulative thermal time should align between fields or years, for example stage 30 in 2021 should have a similar thermal time total to that recorded at stage 30 in 2022. For the validation fields in Germany and Kansas, the LST-derived GDD appears more similar than those from the weather station data.
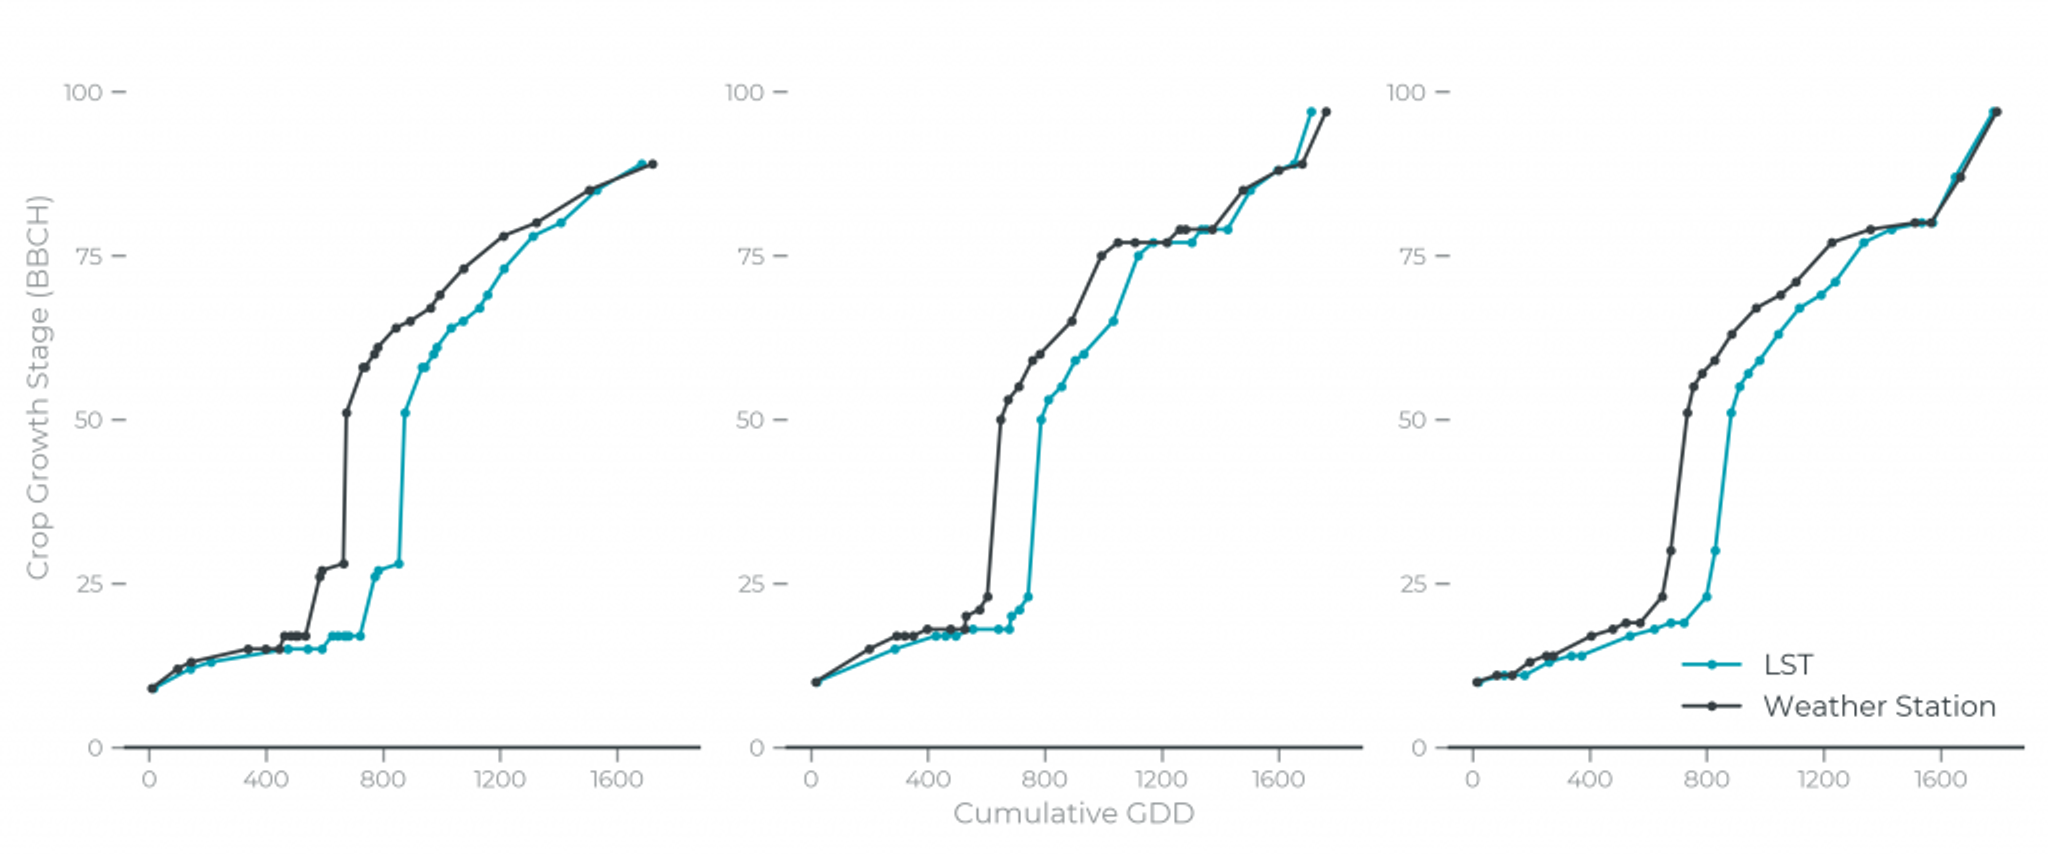
Phenological crop growth stage (BBCH) against cumulative thermal time for Rapeseed fields in Brandenburg, Germany from 2021 (left), 2022 (center) and 2023 (right).
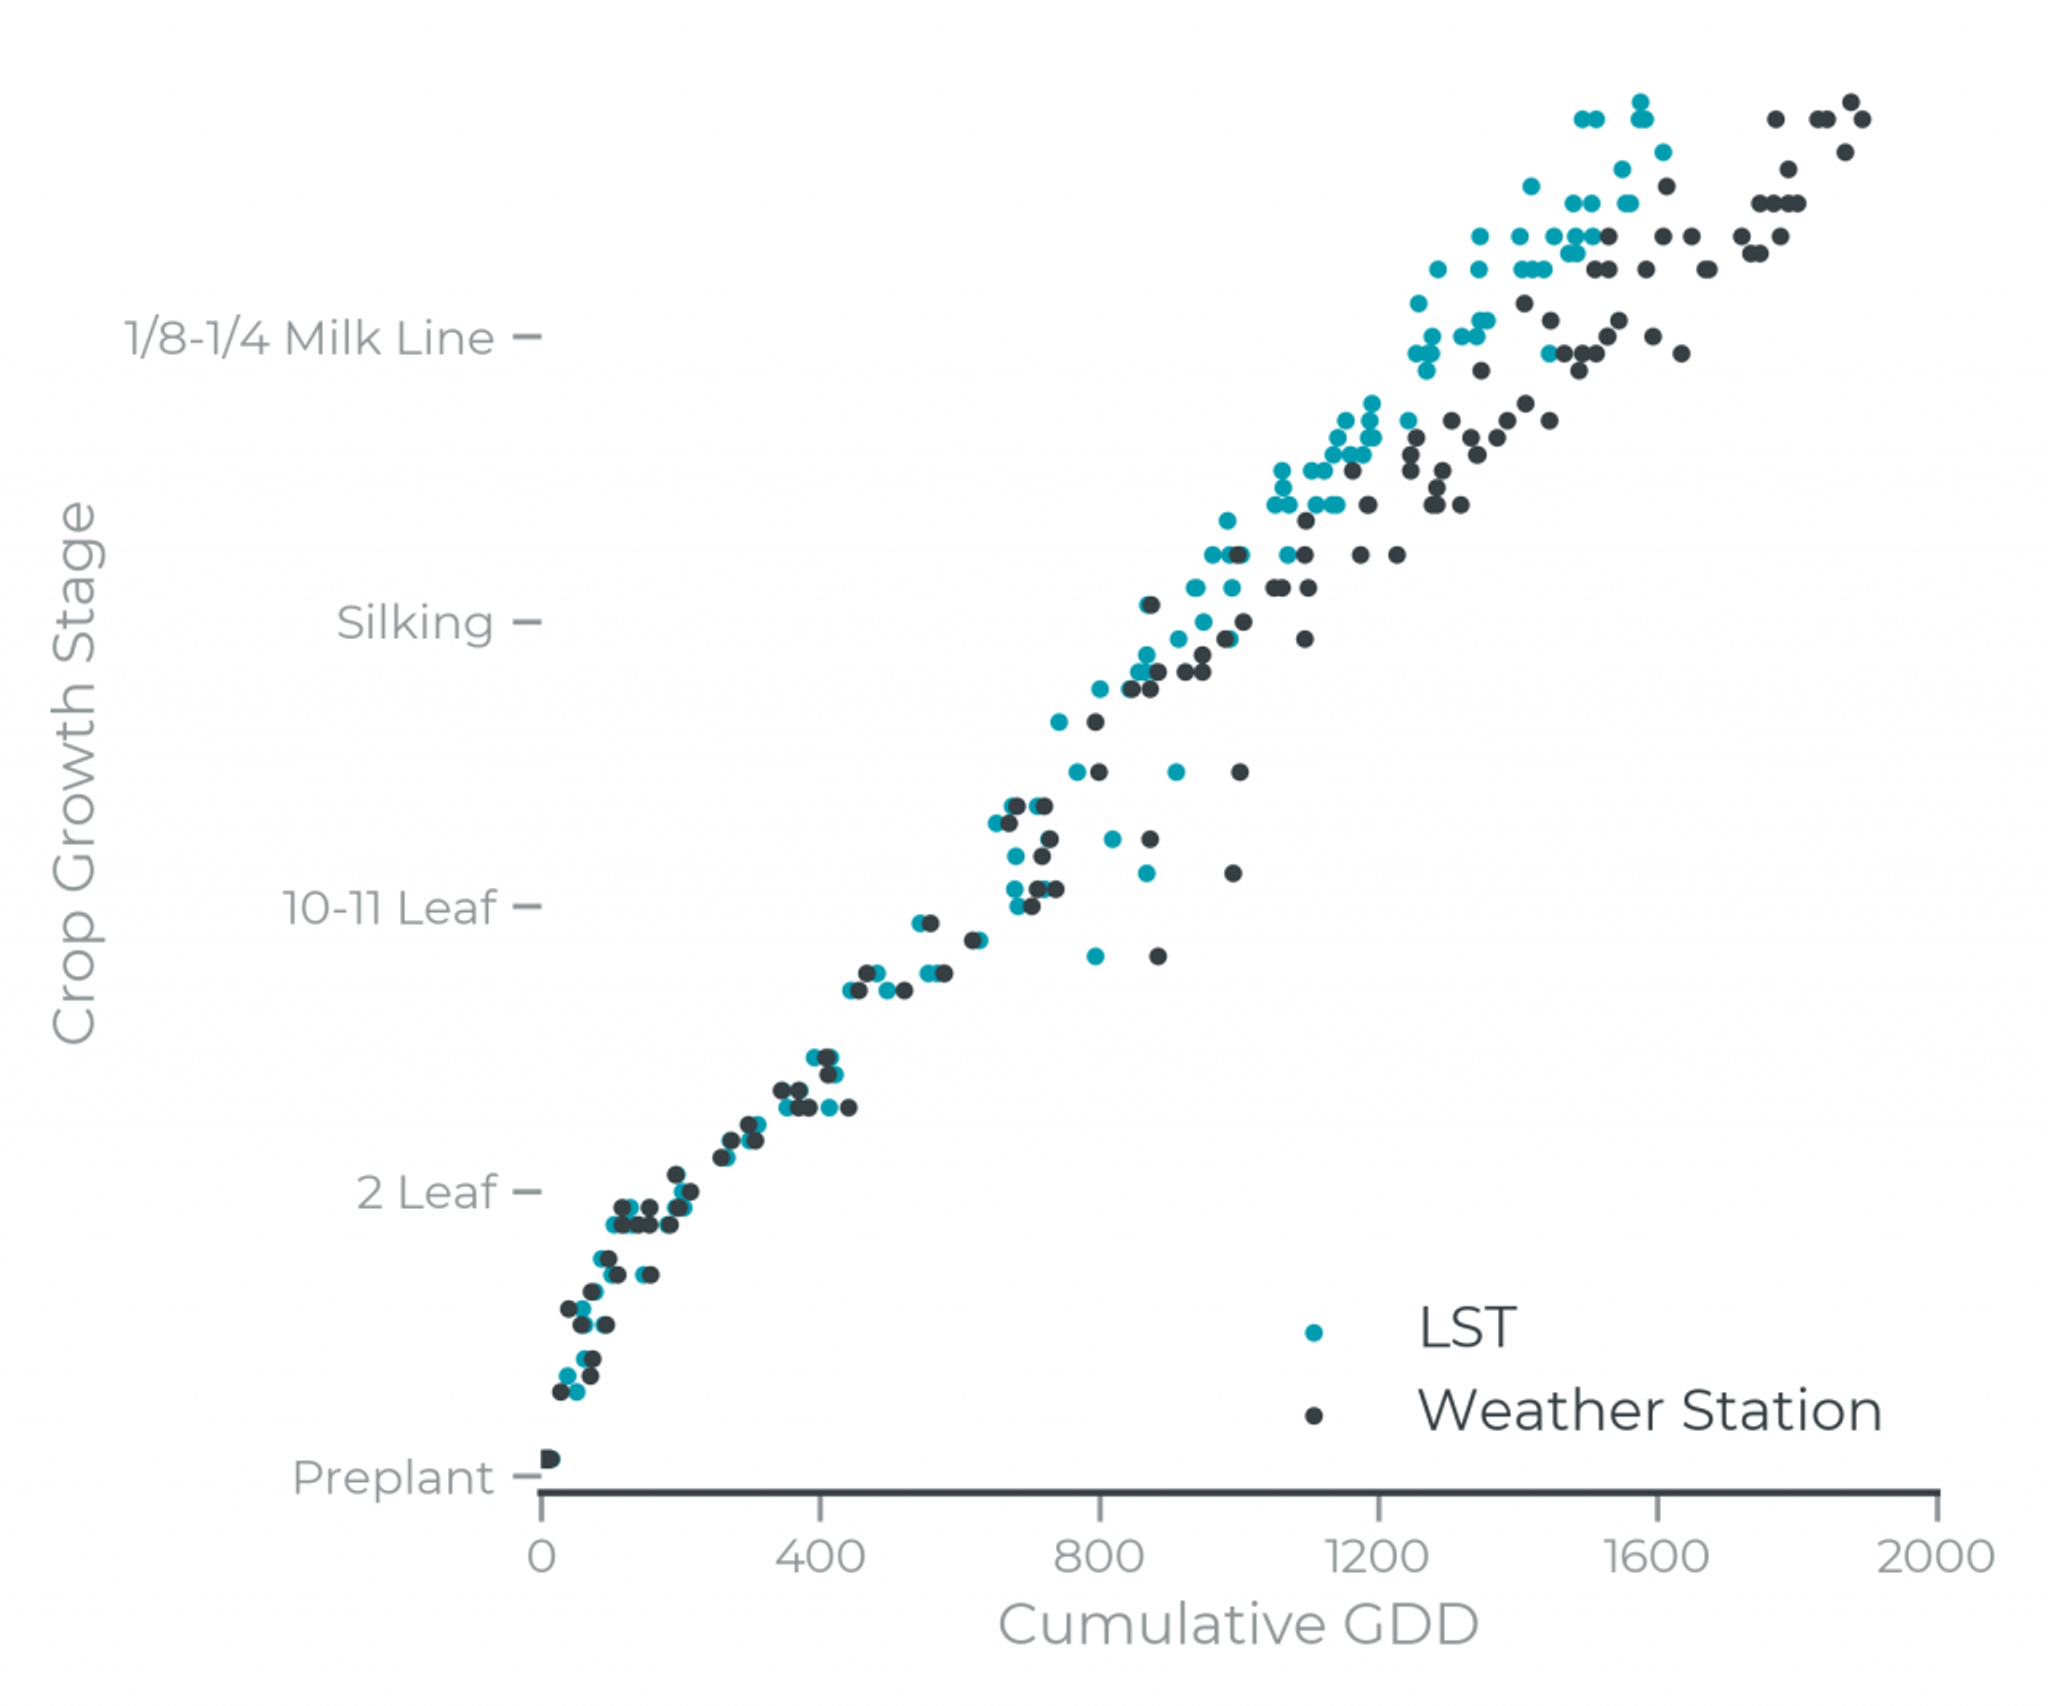
Phenological crop growth stage against cumulative thermal time for Maize fields in Kansas, US.
GDD can also be used to compare crop conditions at the same development stage across fields or years. For example, by indexing NDVI on accumulated thermal time rather than calendar day, productivity at similar thermal energy or growth can be more easily compared.

Planet Fusion NDVI indexed by day after emergence (left) for all wheat fields and indexed by cumulative thermal time from LST (right).
Try Out Land Surface Temperature
Want to try this workflow out? Sign up for a 30-day free trial for Planet Insights Platform and get access to the Land Surface Temperature data used in this blog. Follow along with the workflow in this Python Notebook.
Acknowledgements
The work was performed under the research project NaLamKI which has received funding from the Federal Ministry for Economic Affairs and Climate Action of Germany BMWK (Teilvorhaben 01MK21003G). The two phenology datasets which were used for validation were provided by the Leibniz Centre for Agricultural Landscape Research ZALF (PatchCROP) and CropQuest, Inc. (Kansas). The weather station data was sourced from publicly available data from the German Weather service (DWD) and Kansas Mesonet.

Ready to Get Started
Connect with a member of our Sales team. We'll help you find the right products and pricing for your needs.


