Satellite Science: How Earth Observation Data Furthers Our Understanding of the World
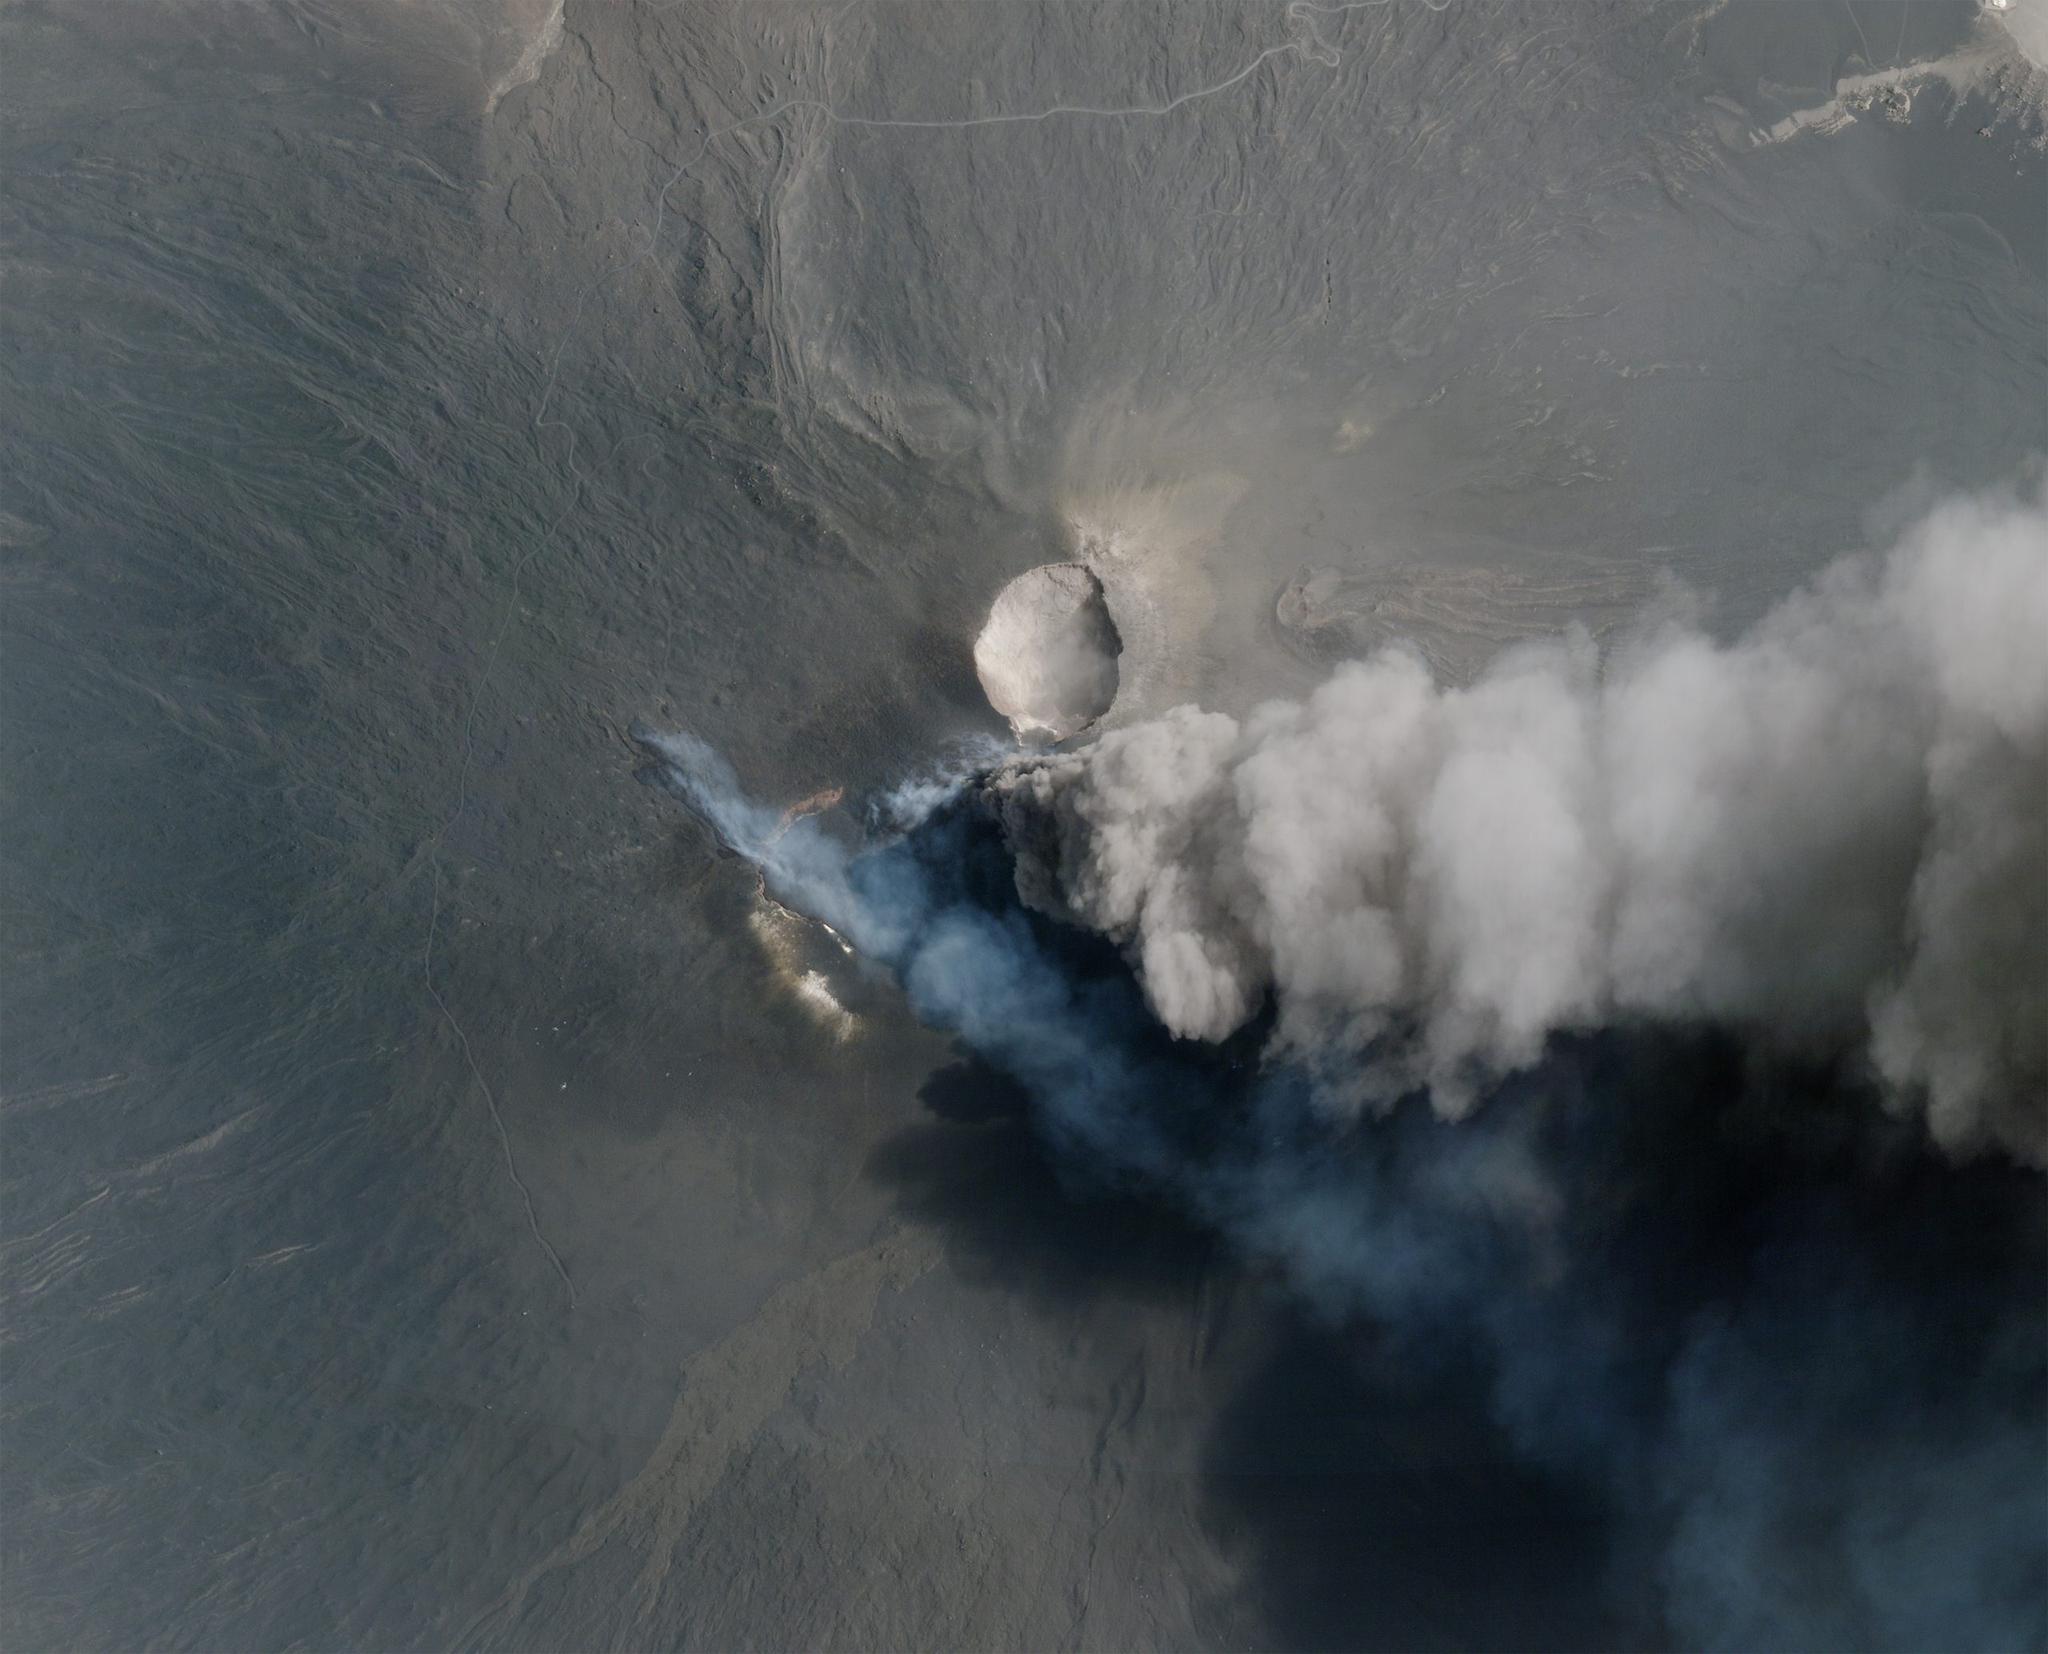
StoriesSatellites can’t answer philosophical questions about the sound of a tree falling in a forest, but they can answer scientific ones, like where and when it fell and its carbon impact. For decades, scientists have turned to Earth observation satellites to measure the status of the systems that support life on Earth and the degree of our departures from them. Their research has led to pivotal discoveries like the collapse of the Thwaites Glacier, the massive aquatic Hunga Tonga-Hunga Ha’apai eruption, and the critical insights derived from monitoring penguin poop in Antarctica.
Science underpins our understanding of the natural world, and, increasingly, satellite data underpins that science. The NASA/USGS Landsat program generated an estimated $25.6 billion in value last year alone—a testament to the indispensable role EO satellites play in tracking high-level patterns and connecting what’s happening on-the-ground to large-scale impacts. And yet that value hardly covers the total benefit that’s available.
Planet’s science program complements both large-scale government initiatives and scientific teams by providing researchers with a unique dataset specifically tailored for high-resolution and time-series analysis. Like the layers of glacial ice that form over time, our archive contains year-over-year information that helps analysts better understand the past and how it informs the trends shaping our future.
Ancient cities hidden in dense jungle, landslides on the roof of the world, rusty rivers in Alaska—read on for a preview of what happens when research meets satellite data.
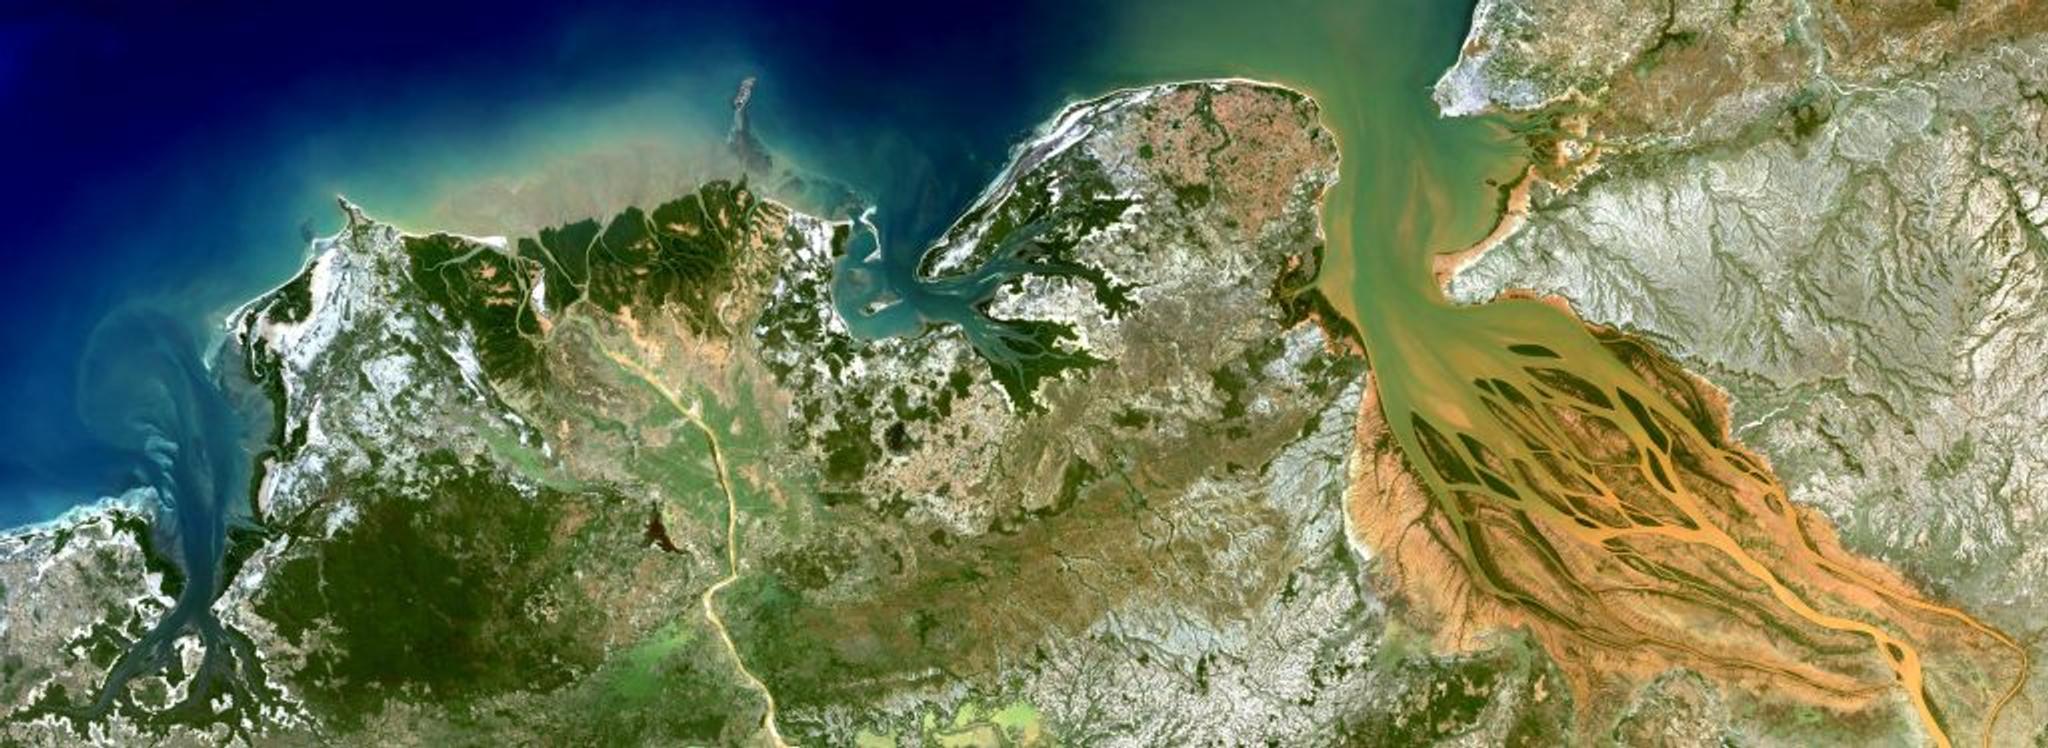
NICFI Madagascar Mosaic • Planet data processed by Ocean Ledger
A landslide, a melting glacier, and a tsunami walk into a fjord. The punchline? Seismic waves vibrating across the Earth for nine days. In September 2023, a 1,200-meter-high mountain peak collapsed in Greenland after the glacier supporting it from below melted. The resulting landslide triggered a 200-meter high tsunami that sent shockwaves reverberating across the planet for over a week (earthquakes only last minutes to hours by comparison). A recent Guardian article used Planet imagery to uncover how researchers finally pieced together the mystery, and outlined the ramifications for how Arctic melting catalyzes a warming world.
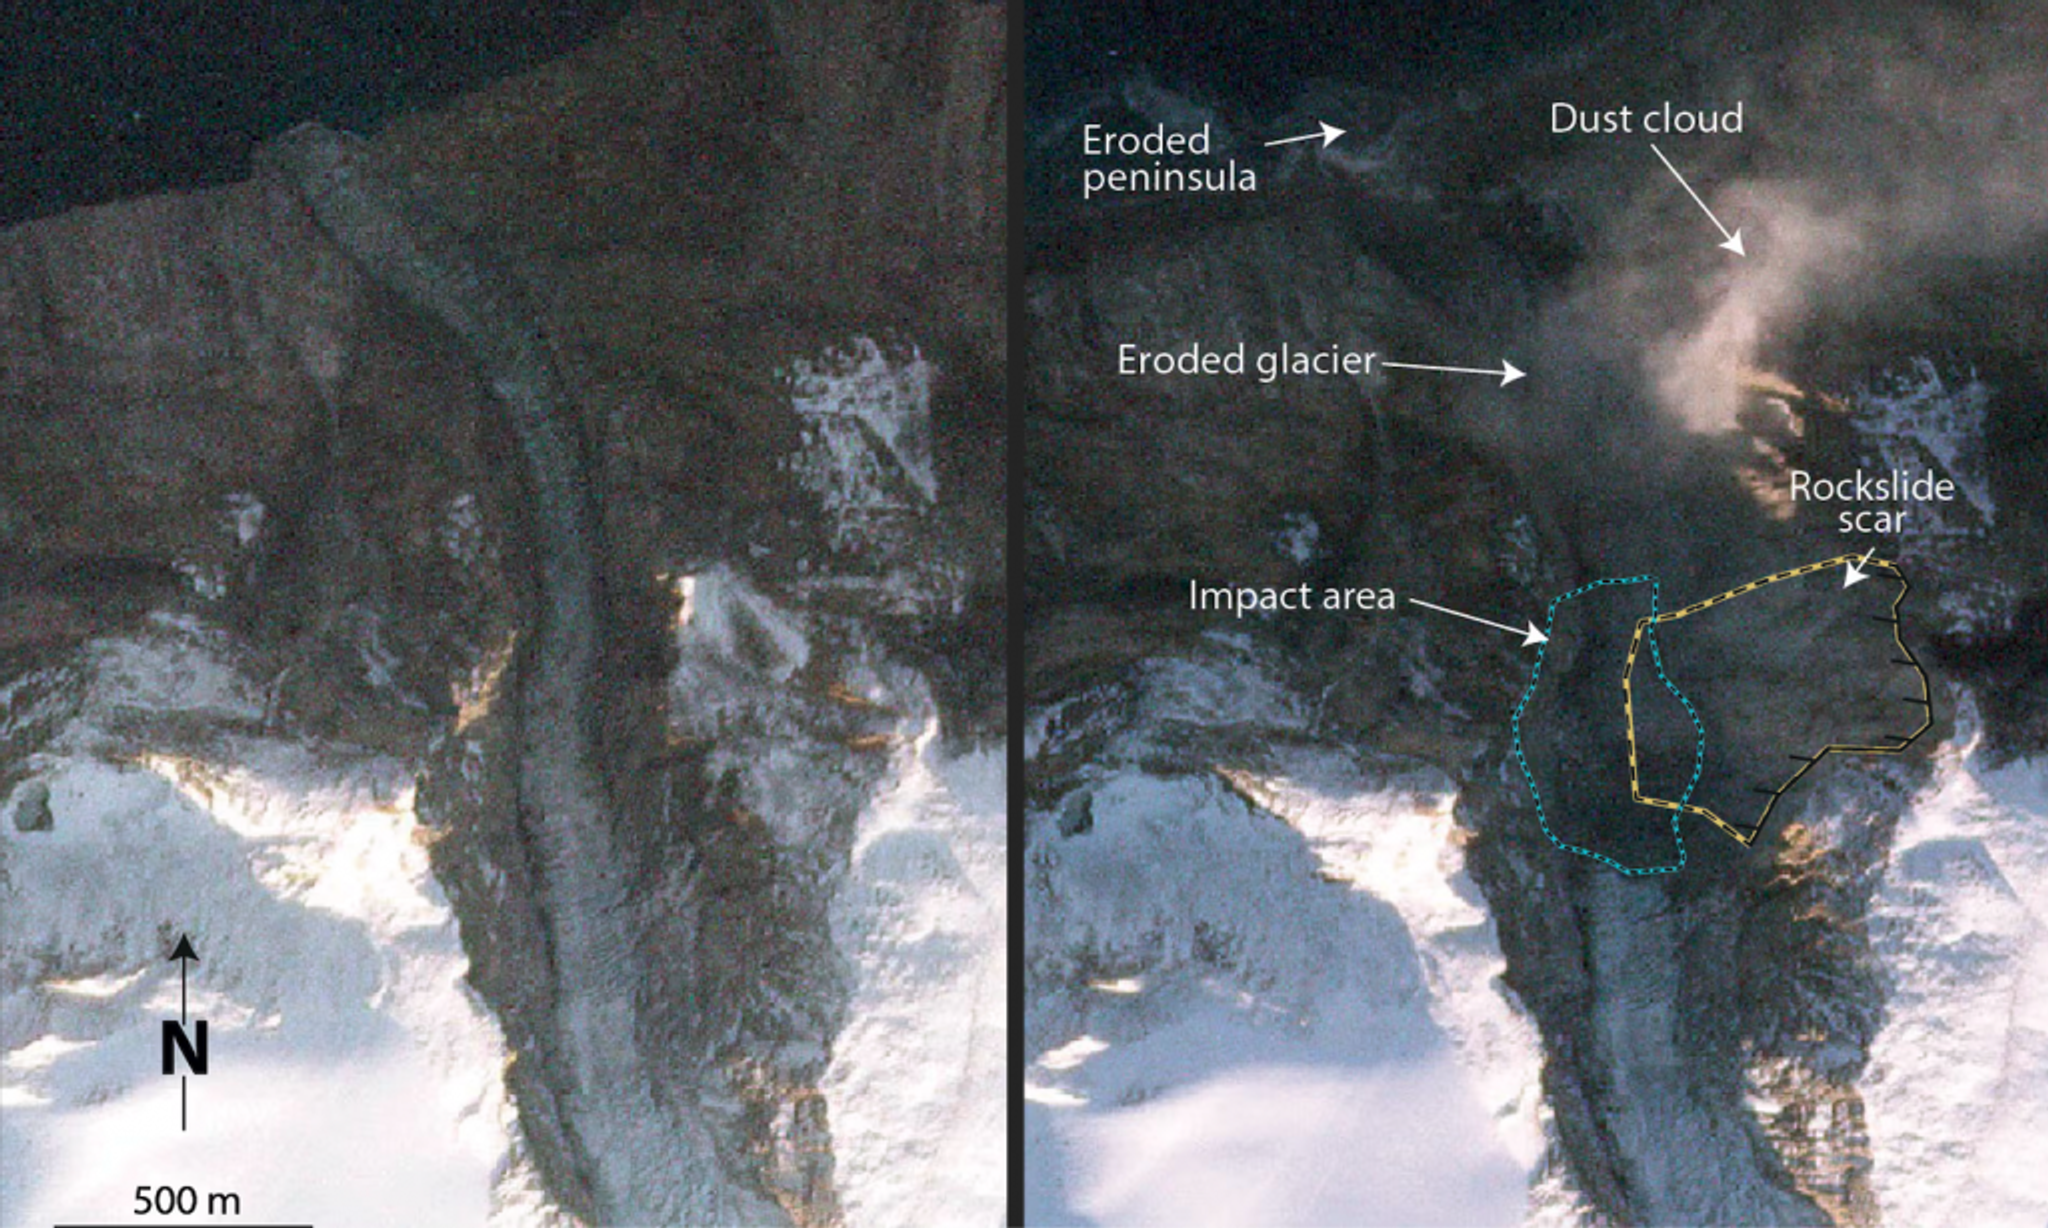
The fjord system before and after the landslide and tsunami • Analysis by The Guardian. Data from Planet Labs PBC
4D Archaeology feels like a reference to the aliens-building-the-Pyramids conspiracy theory, but it really just describes the modern state of archaeology. Researchers argue that the availability of Planet’s high spatial and temporal resolution multispectral dataset can unearth new approaches to archaeological research. This October, a PhD student discovered a lost Mayan city using Lidar—a remote sensing practice that uses lasers to map topography—over a remote part of the Mexican jungle. Out with the shovels, in with the satellites.
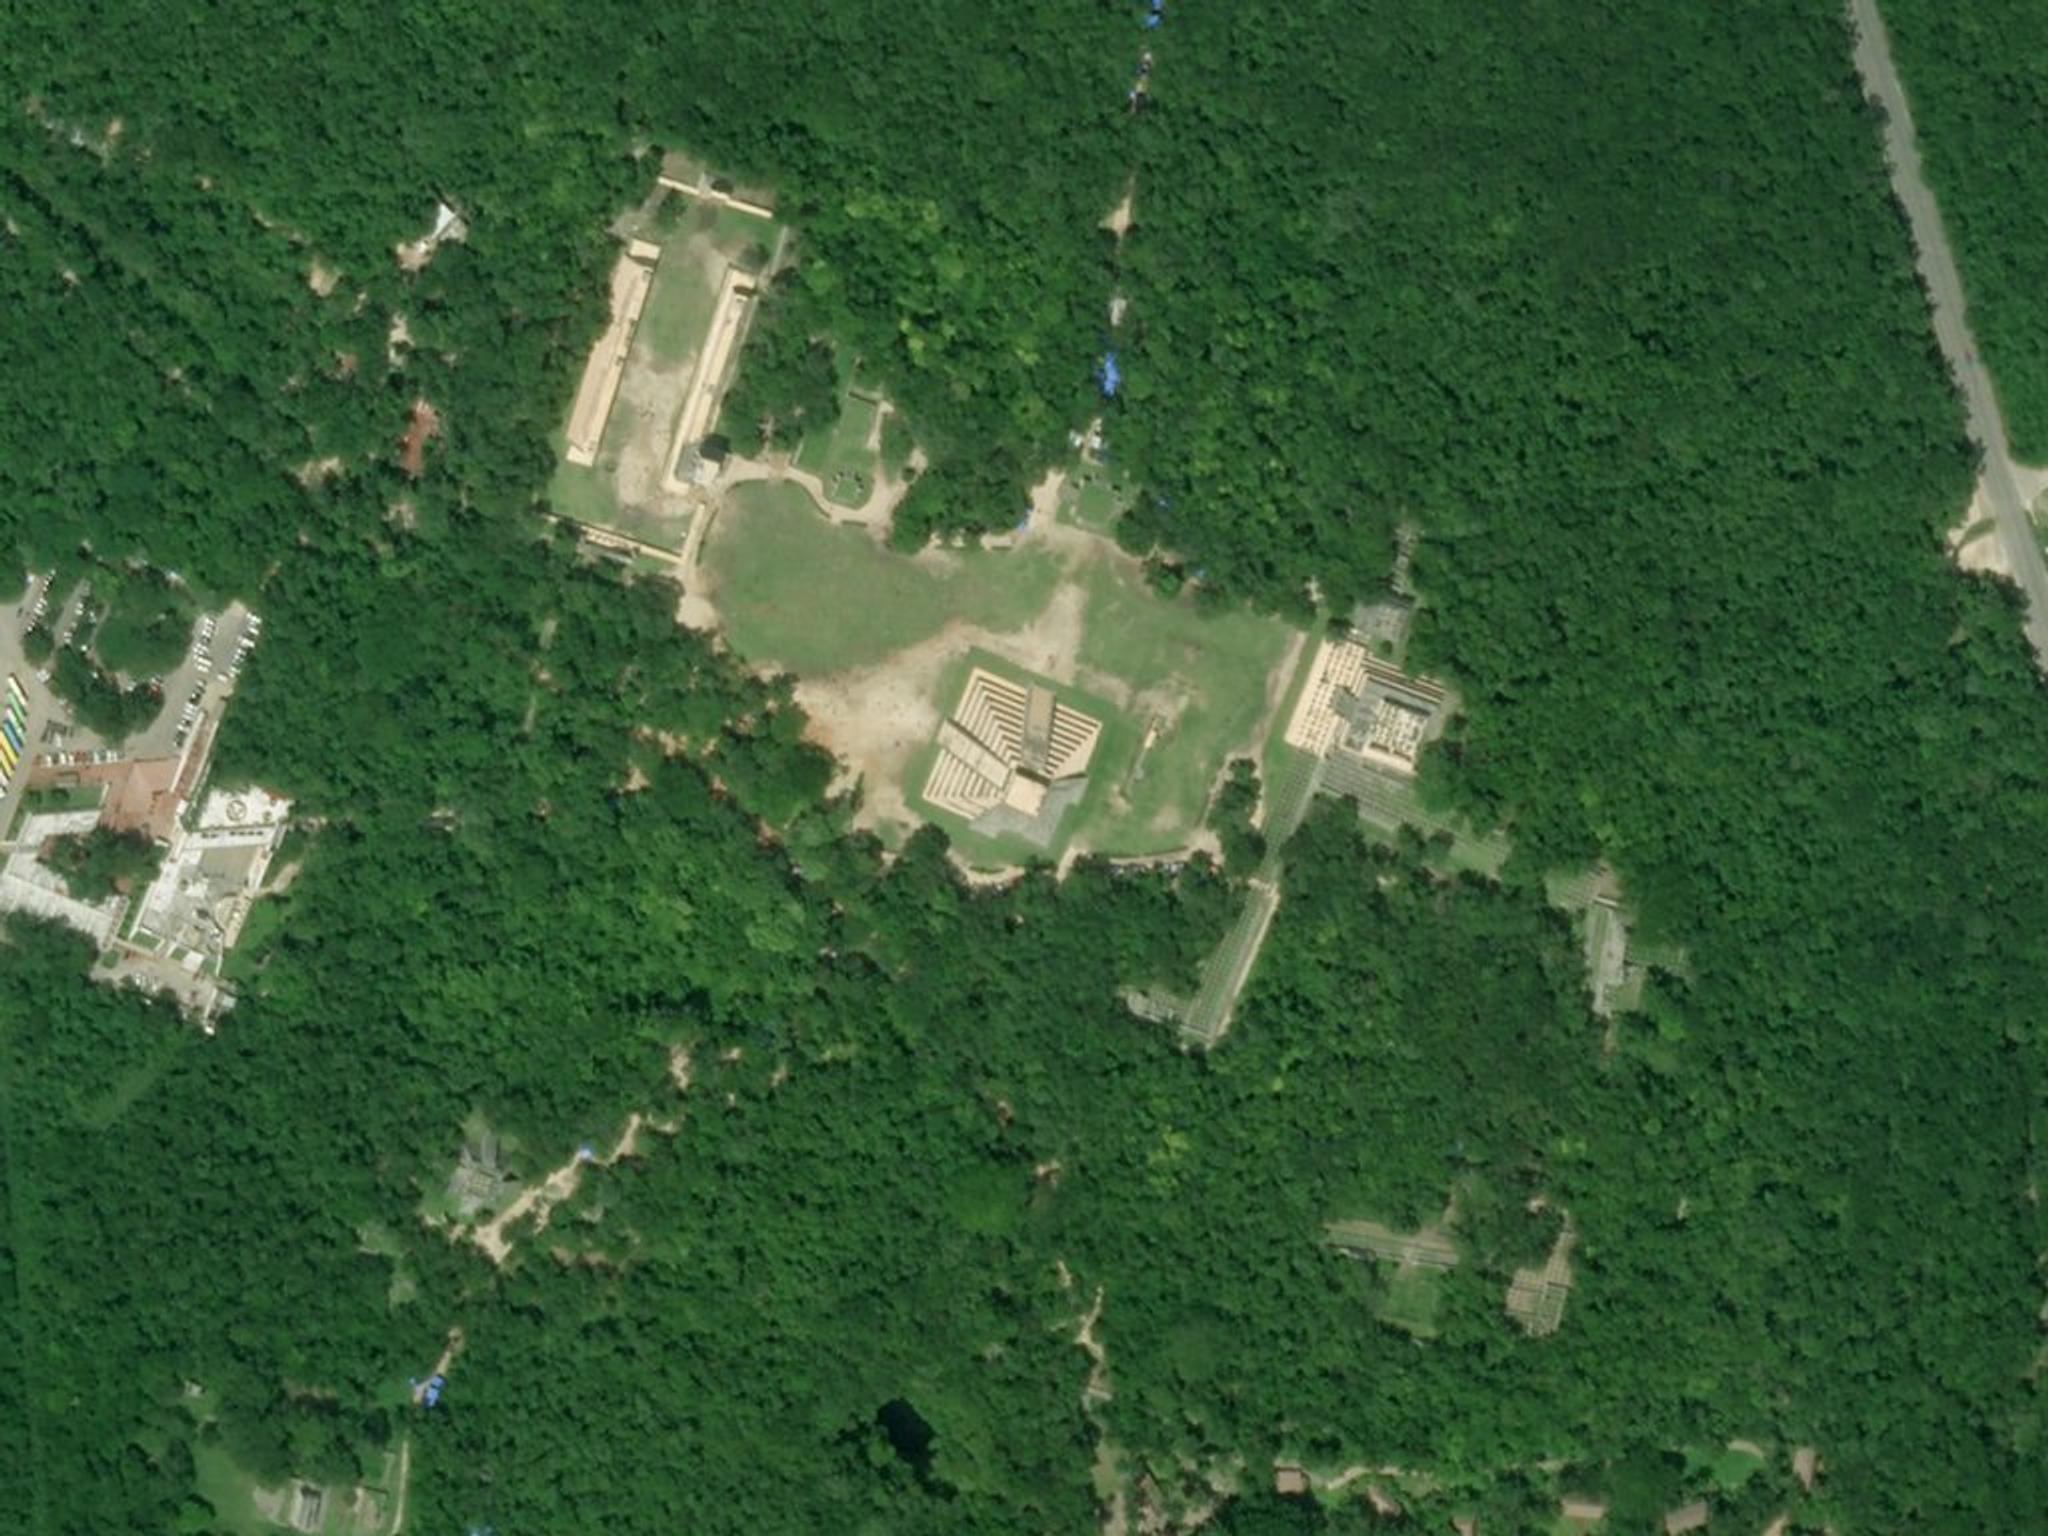
SkySat • Chichén Itzá, Yucatán, Mexico • August 21, 2022
One visual indicator of Earth’s corroding health is Alaska’s rivers changing color from blue to orange. A recent study found that thawing permafrost is releasing toxic metals like iron, zinc, and copper into the state’s waterways. The researchers turned to satellite data to pin down when it started around 2017 and 2018—dates that coincided with record warm years.
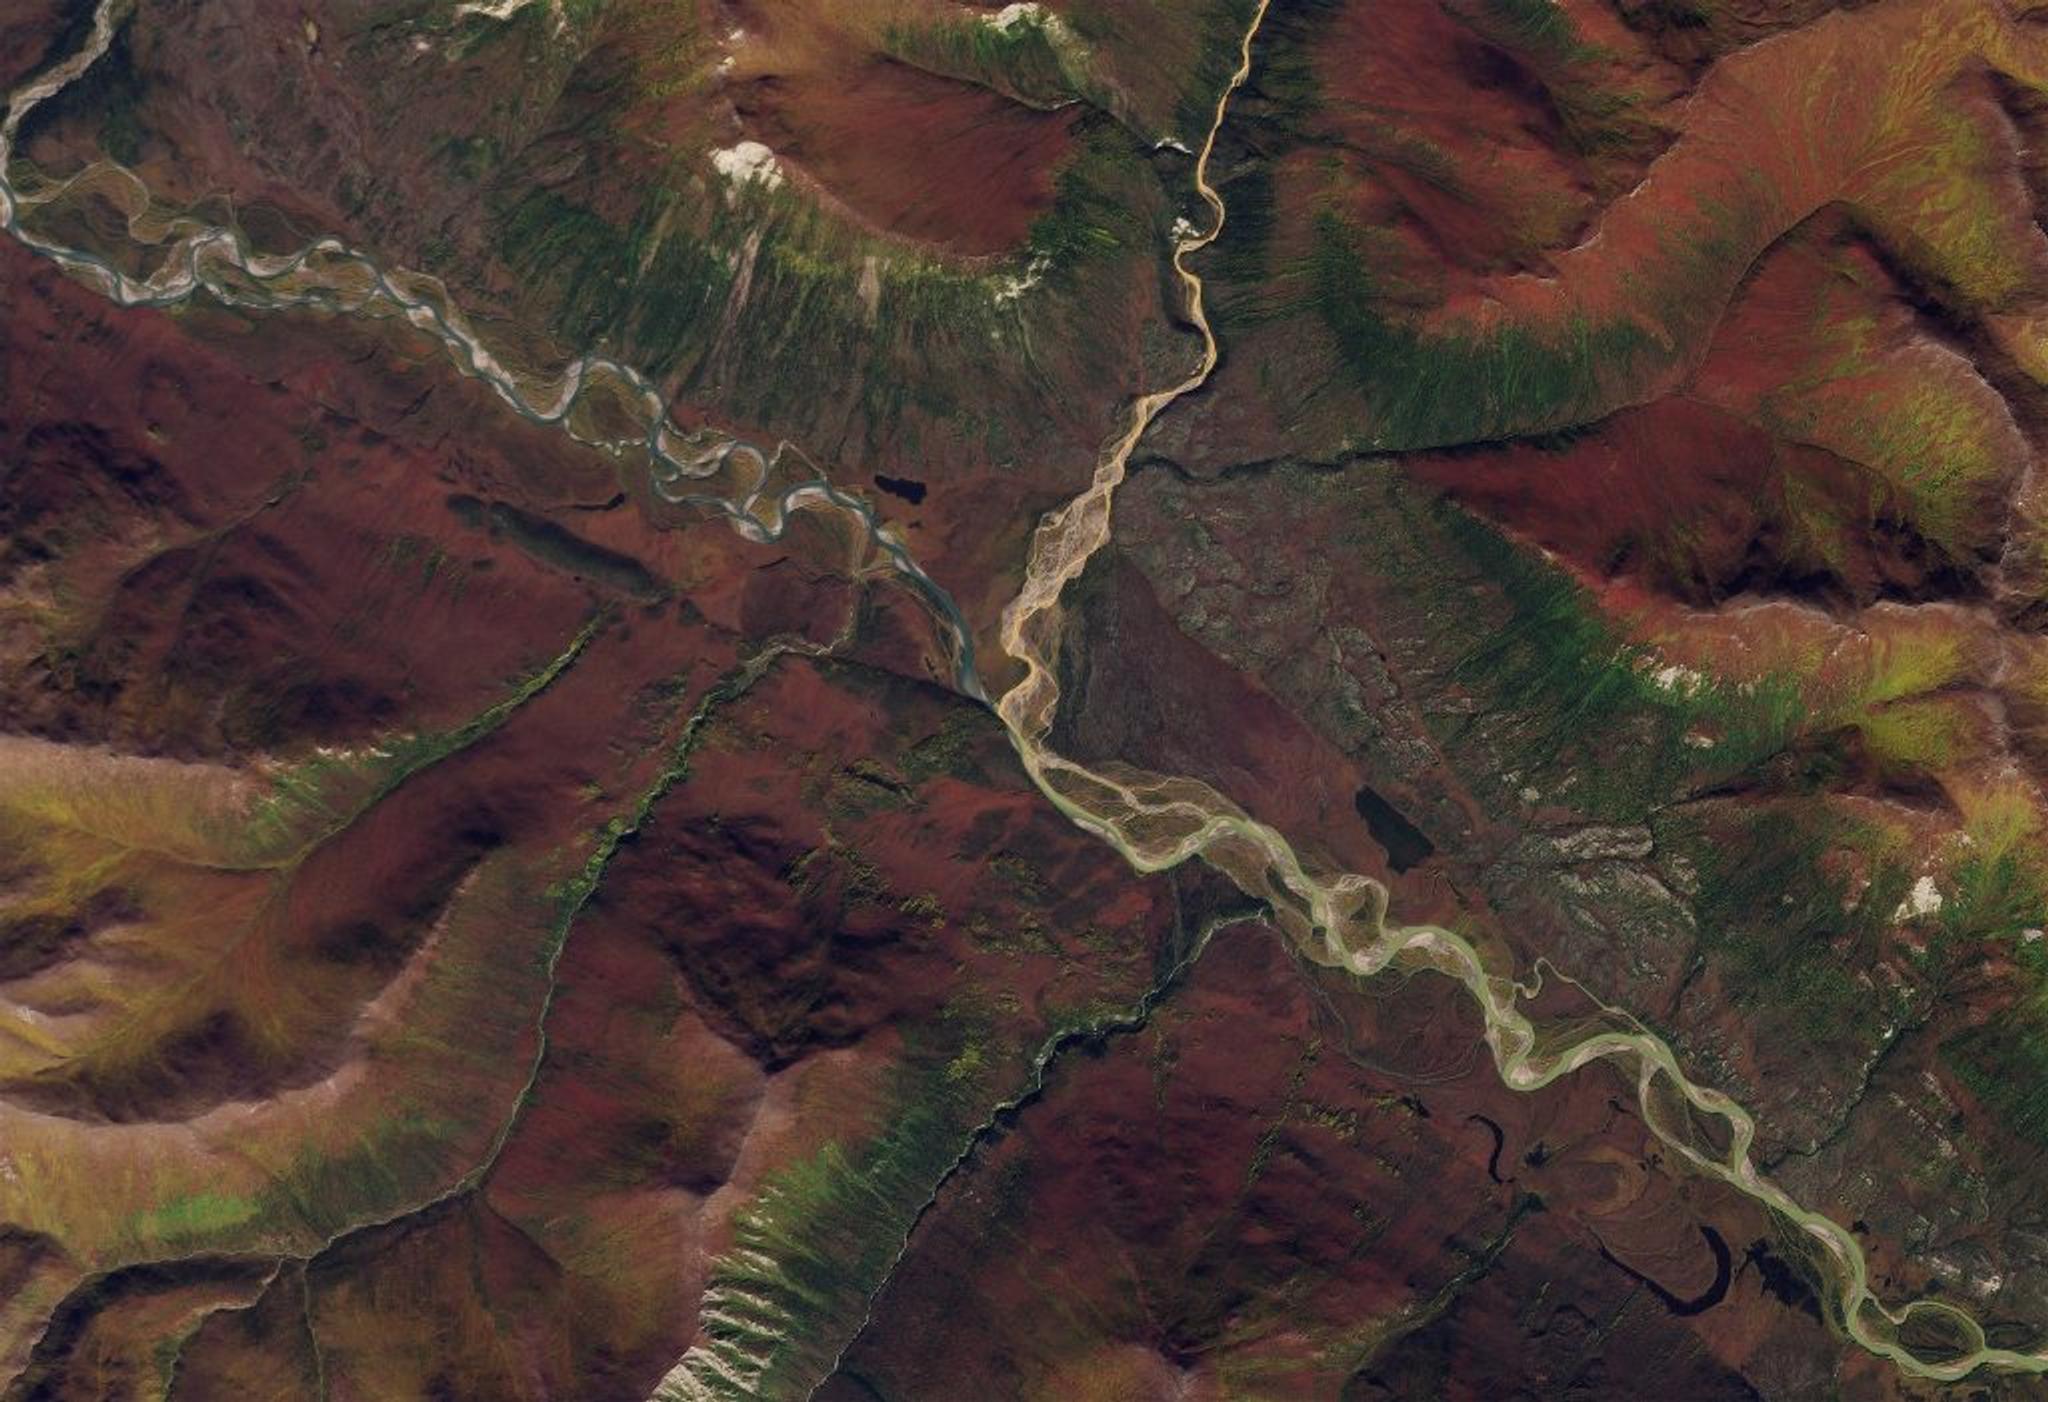
PlanetScope • Gates of the Arctic National Park and Preserve, Alaska, USA • August 30, 2024
Trash has a far greater impact on air quality beyond its foul odor. Removing trash by burning it releases hazardous pollutants into the atmosphere. Countries have introduced bans at municipal facilities to clear the air, but enforcing these regulations is a whole different challenge. Researchers at the Department of Civil and Environmental Engineering at Duke University published a study outlining how Planet satellite data + ML algorithms can help identify waste burning plumes and support mitigation strategies.
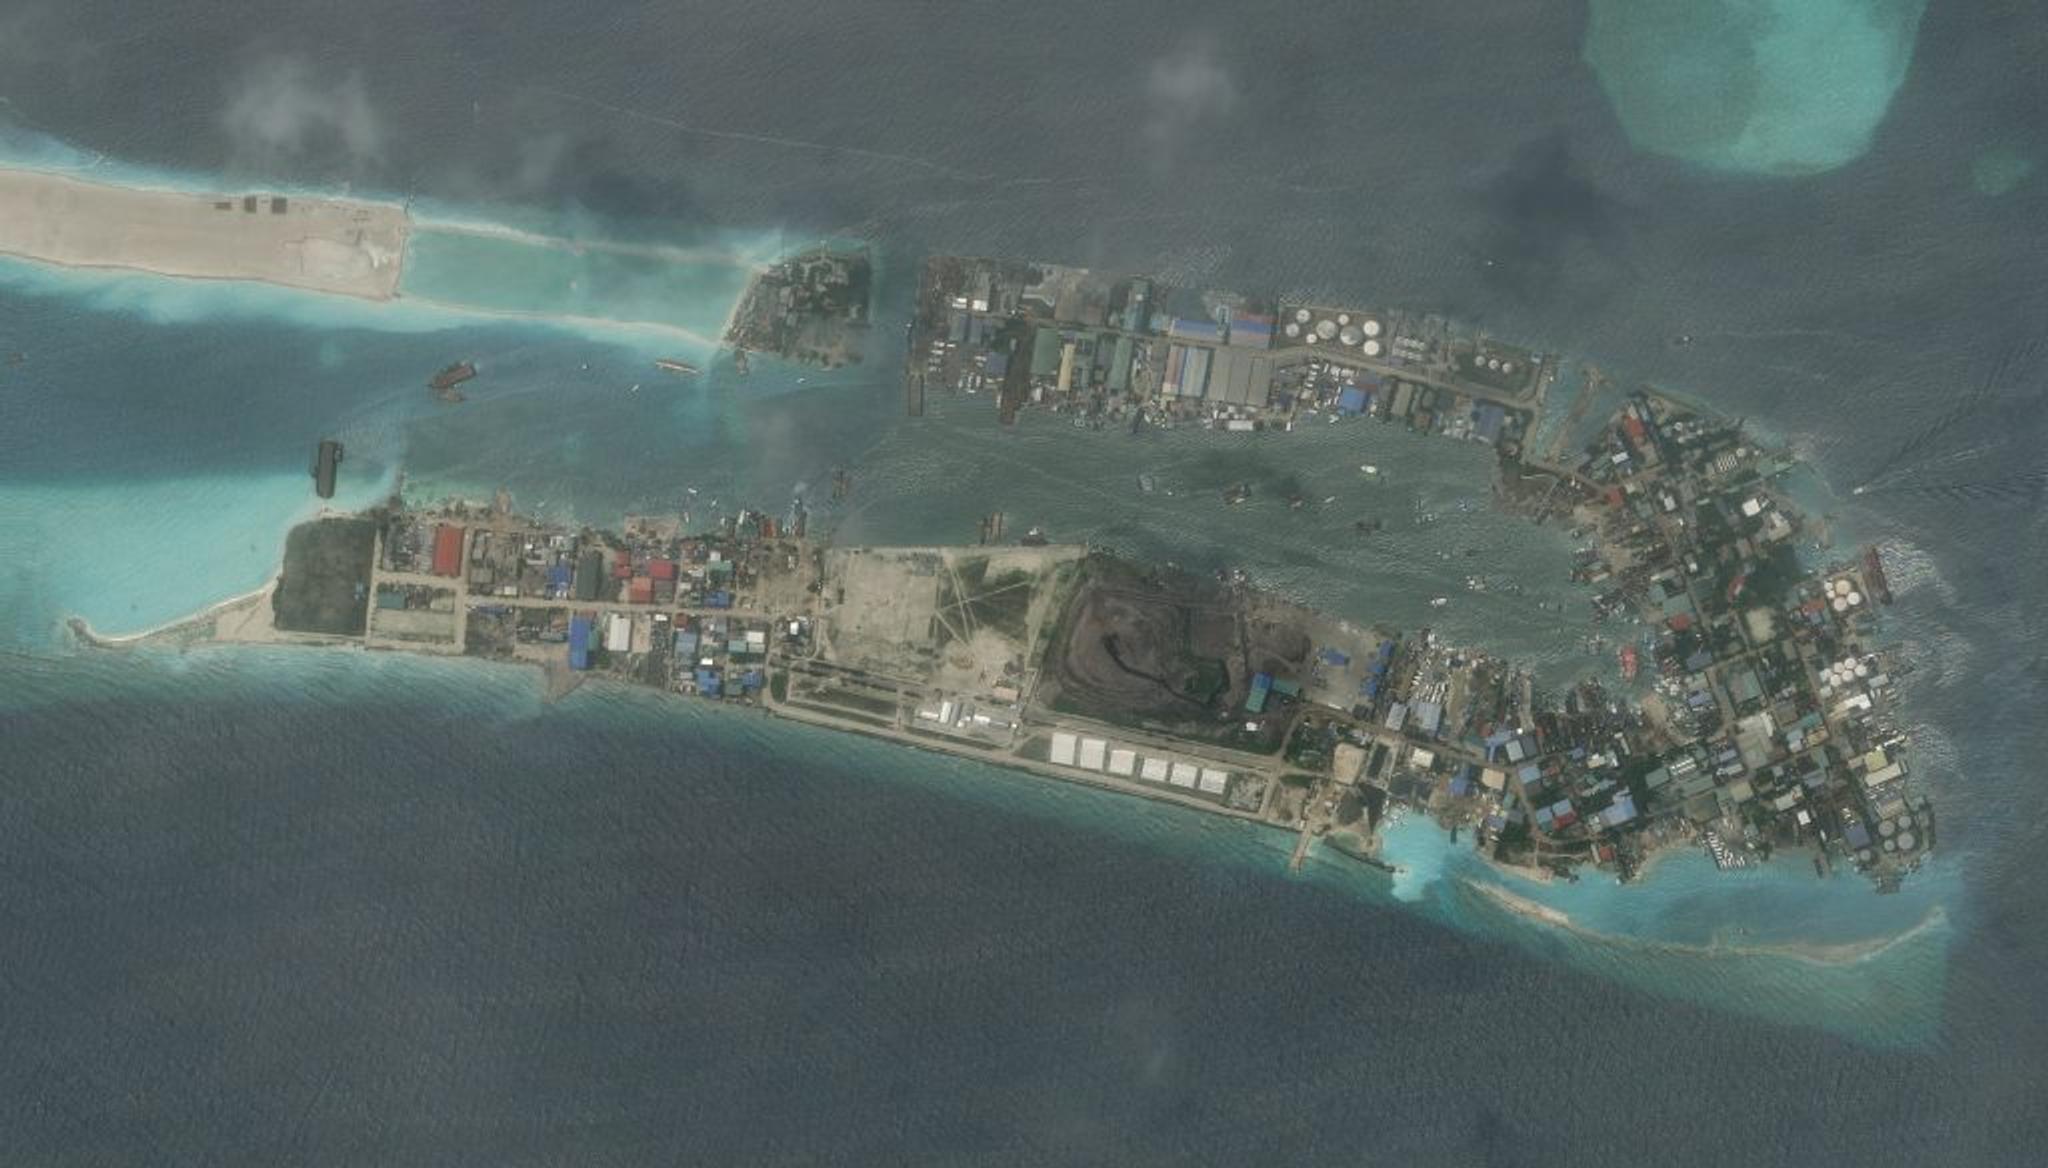
SkySat • Thilafushi landfill, Maldives • May 5, 2023
Scientists hoping to study the far-flung reaches of the Earth without an Odyssey-like trek can now simply use satellites instead. Researchers have used cost-effective remote sensing instruments around the globe, but especially in climate-sensitive areas like Antarctica to monitor events like its overall vegetative greening and the collapse of the Thwaites Glacier.

SkySat • Thwaites Glacier, Antarctica • November 27, 2024
As if the progressive loss of Earth’s cryosphere wasn’t bad enough, the retreat of glaciers and icecaps has concerning implications for sudden floods. Many lakes in high mountain regions are held back by ice-dams that are destabilizing due to rising global temperatures. Scientists studying these ice-dam lakes and failures turn to Planet satellite data for deeper insight into how they’re changing and what that means for the communities living near them.
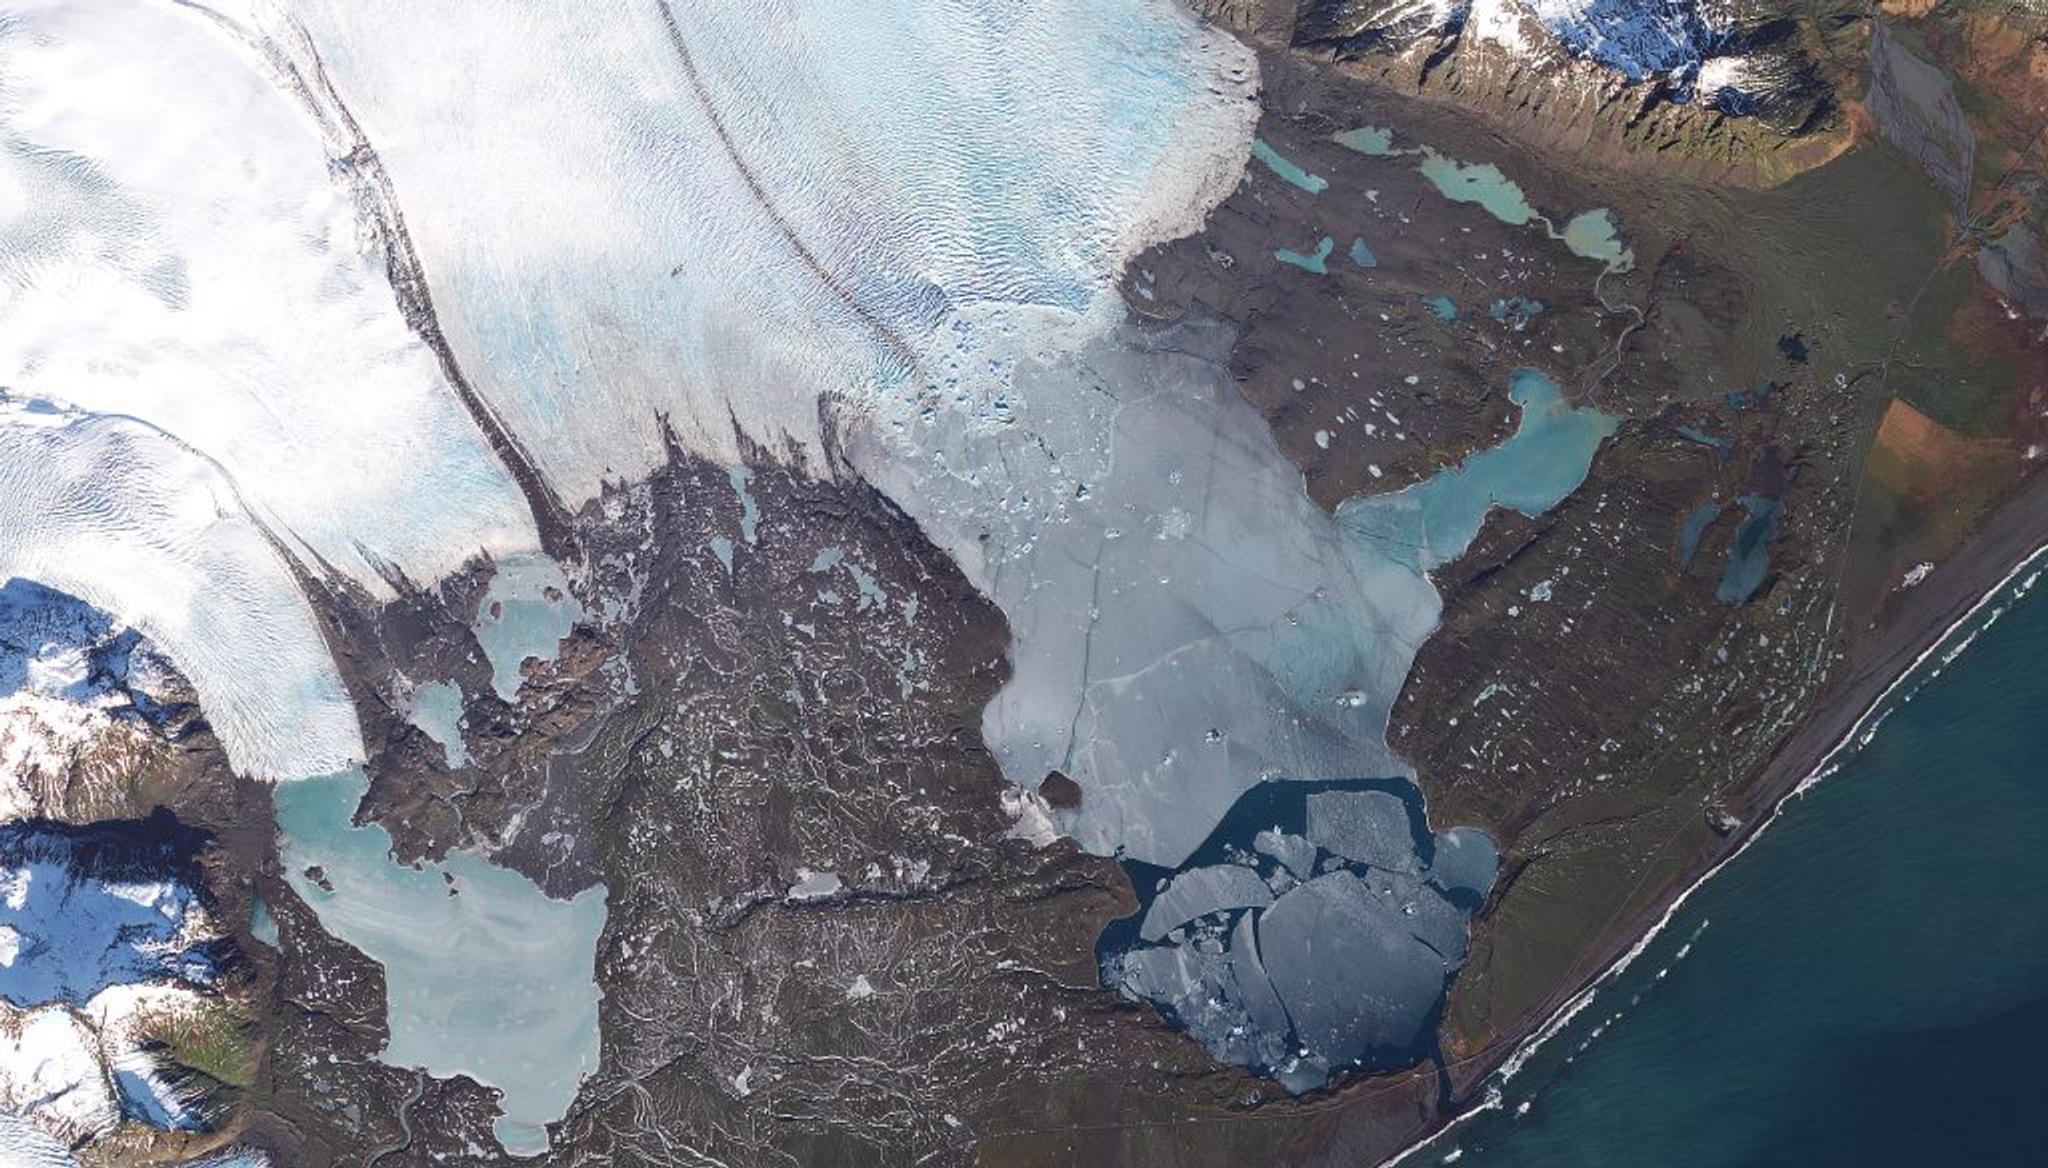
PlanetScope • Jökulsárlón, Iceland • March 2, 2023
Anyone reading this likely understands the incalculable value that forest ecosystems provide the planet. What may be less known, though, is that those forest dynamics actually can be calculated. Our Forest Carbon product provides reliable and frequent data on aboveground forest carbon, tree height, and canopy cover across the world—helping researchers better understand how Earth’s forests are changing.
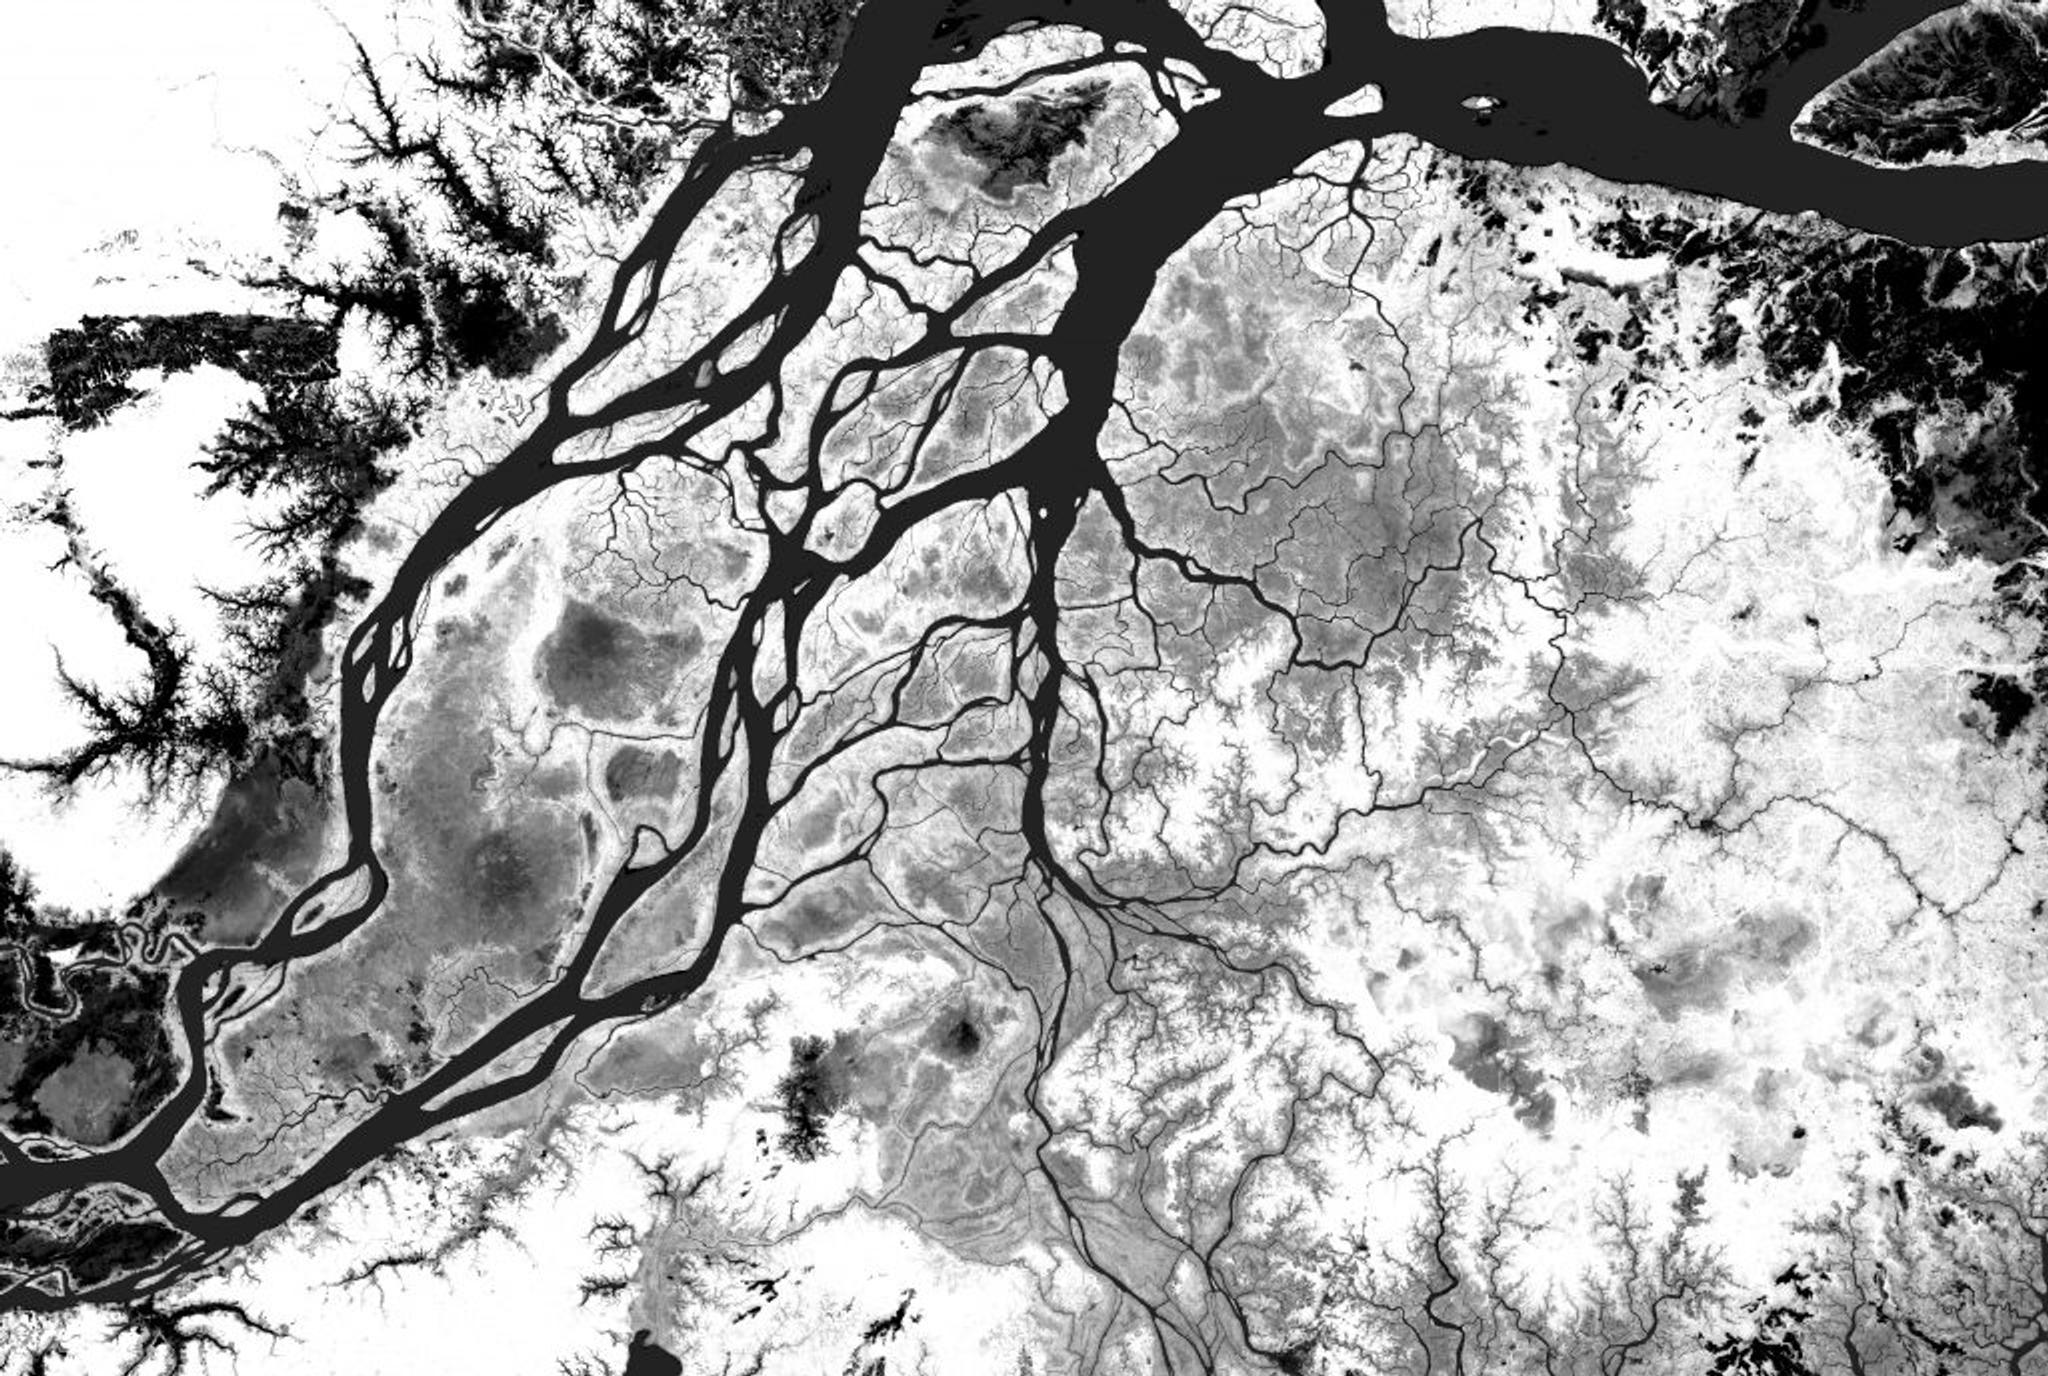
Forest Carbon, Amazon Rainforest
Mapping the land use and environmental impact of cashew production across an entire country is a significant challenge. But training a neural network with high quality satellite data makes the process a bit easier. A new study (currently in pre-print) examines Cambodia’s massive cashew industry in detail and incorporates land cover datasets from PlanetScope, Sentinel-1 & 2, and Landsat imagery to map out the probability of cashew plantations throughout the country. While probably most beneficial to squirrels, the study holds important insights for agriculture and land use development.
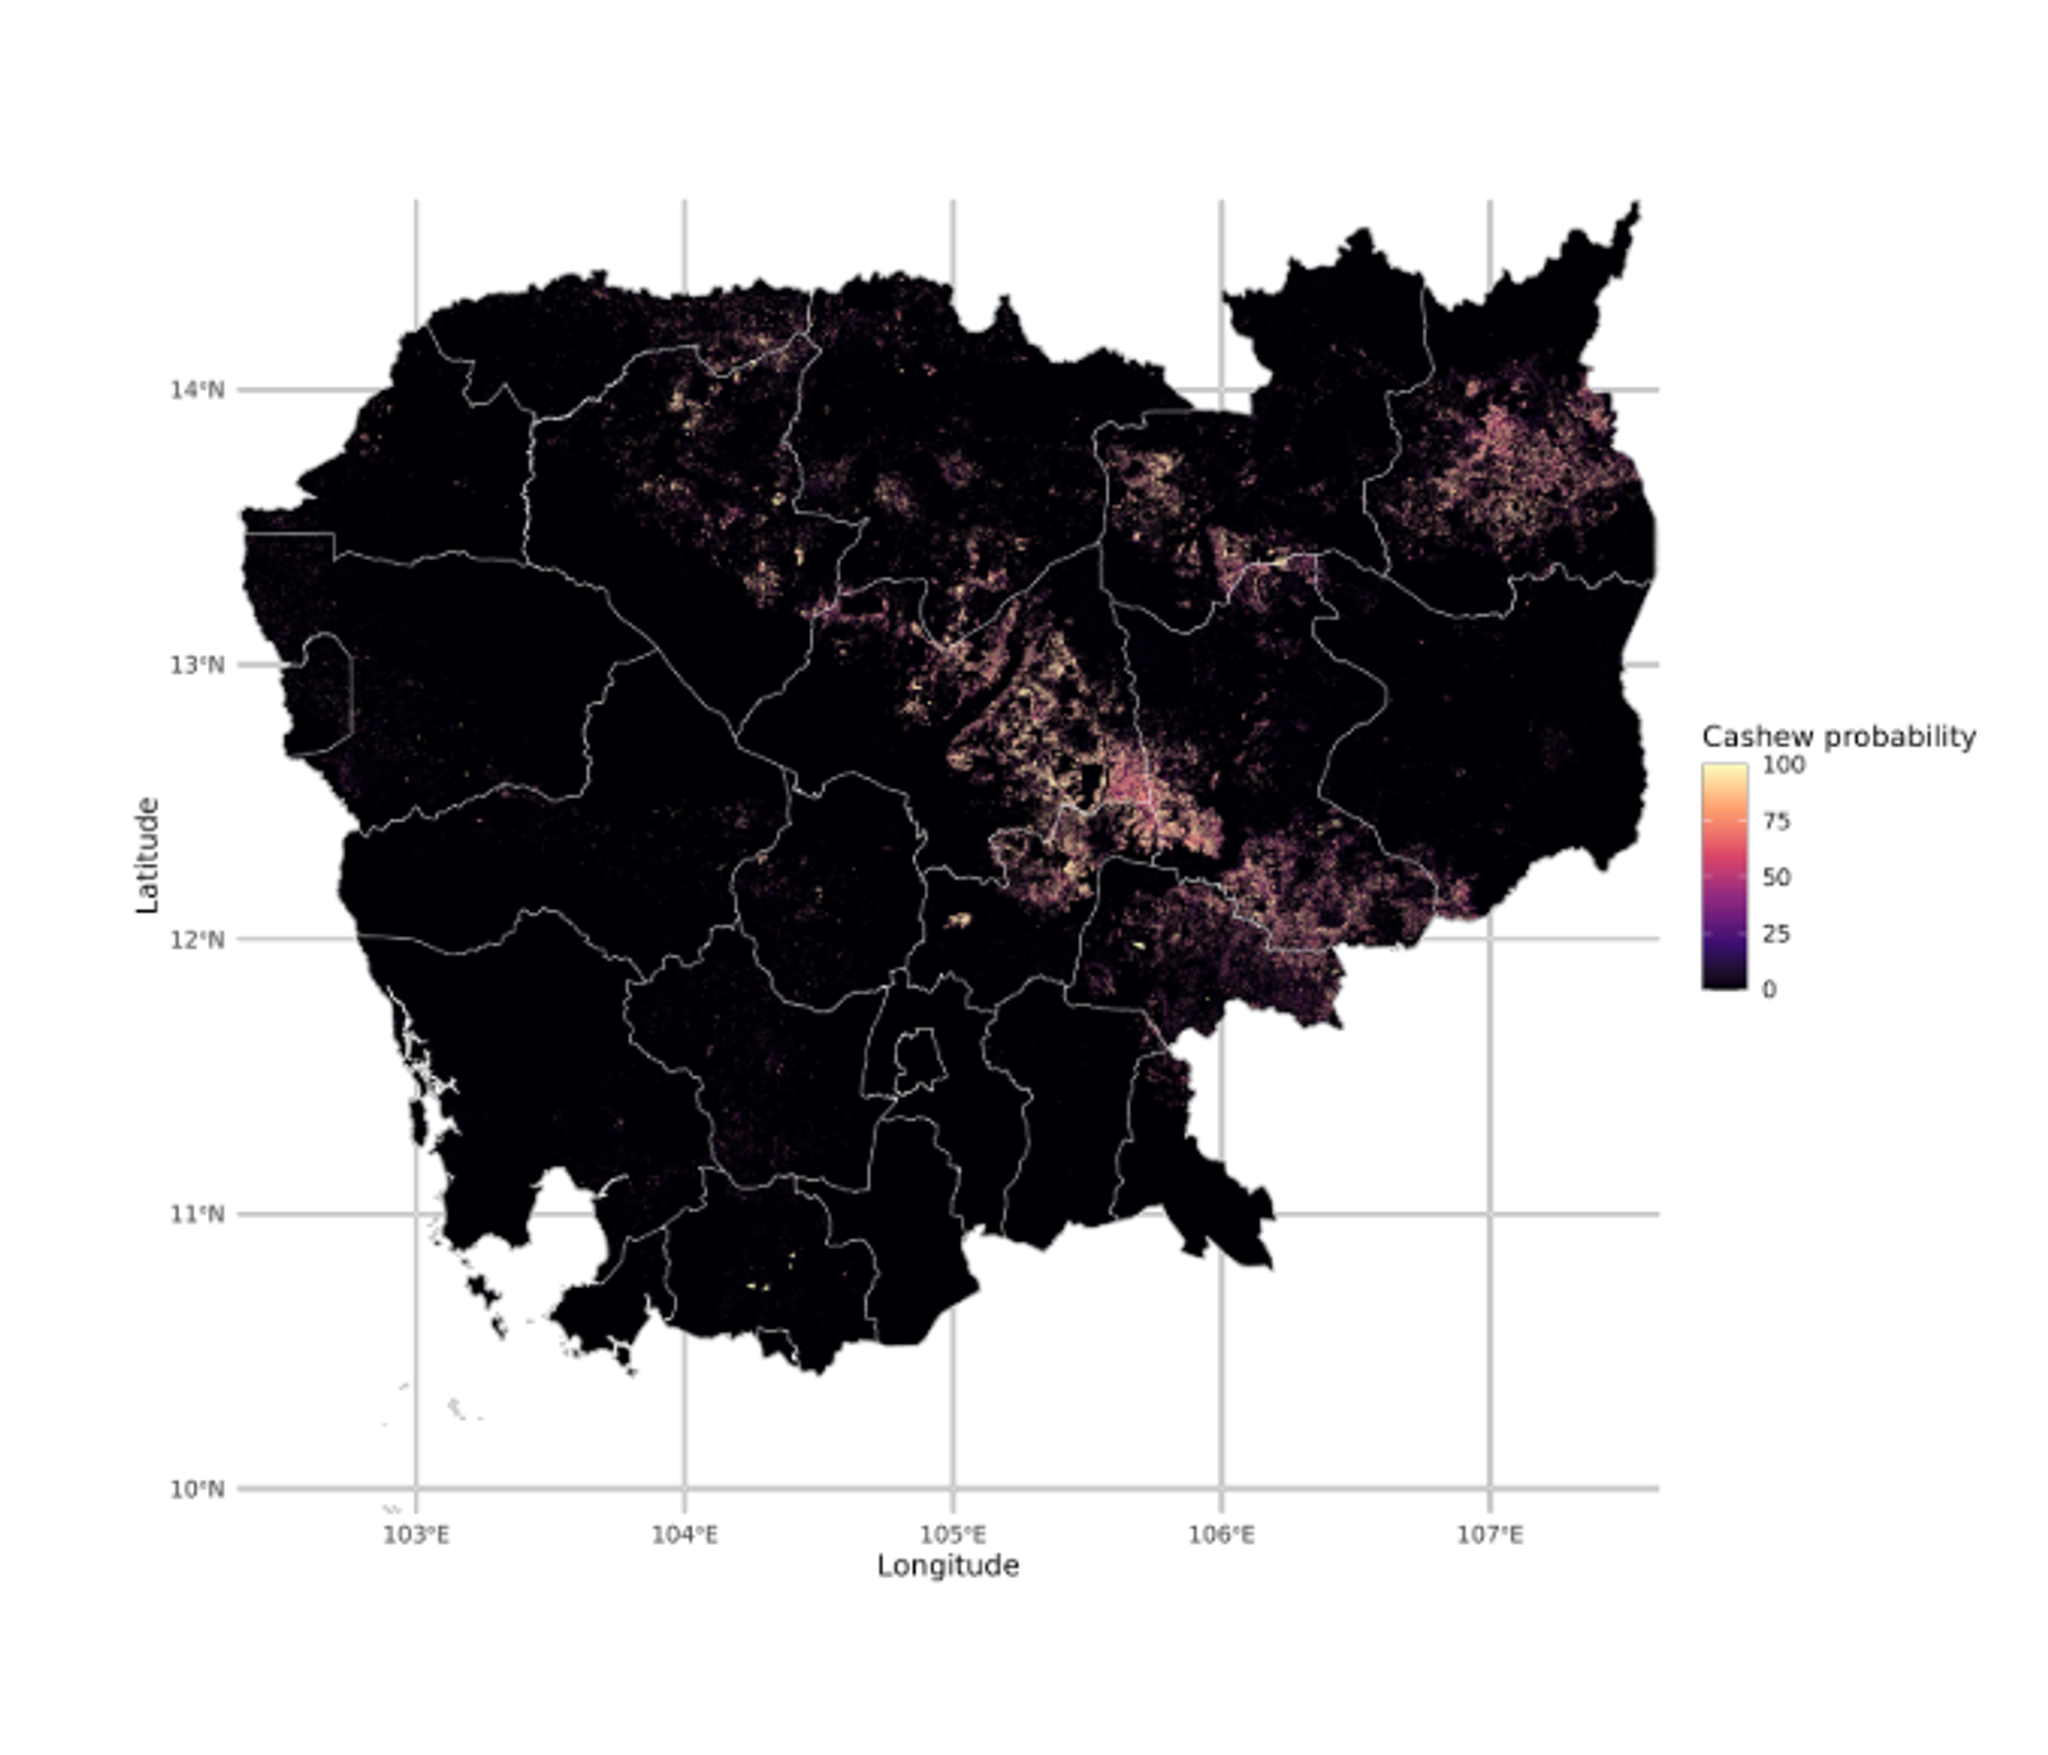
The 2023 cashew probability map for Cambodia
Every rose has its thorn, and for residents along the Estonian coastline that thorn is its rose. Rosa rugosa, a rose species native to eastern Asia, was introduced along the Baltic Sea as an ornamental and dune fixing plant in the 19th century. Now the invasive species is outcompeting other plants and negatively affecting the ecosystem. To support eradication programs, research led by the Estonian University of Life Sciences is leveraging both drone and PlanetScope satellite data to map the species’ extent across the country’s coastline.
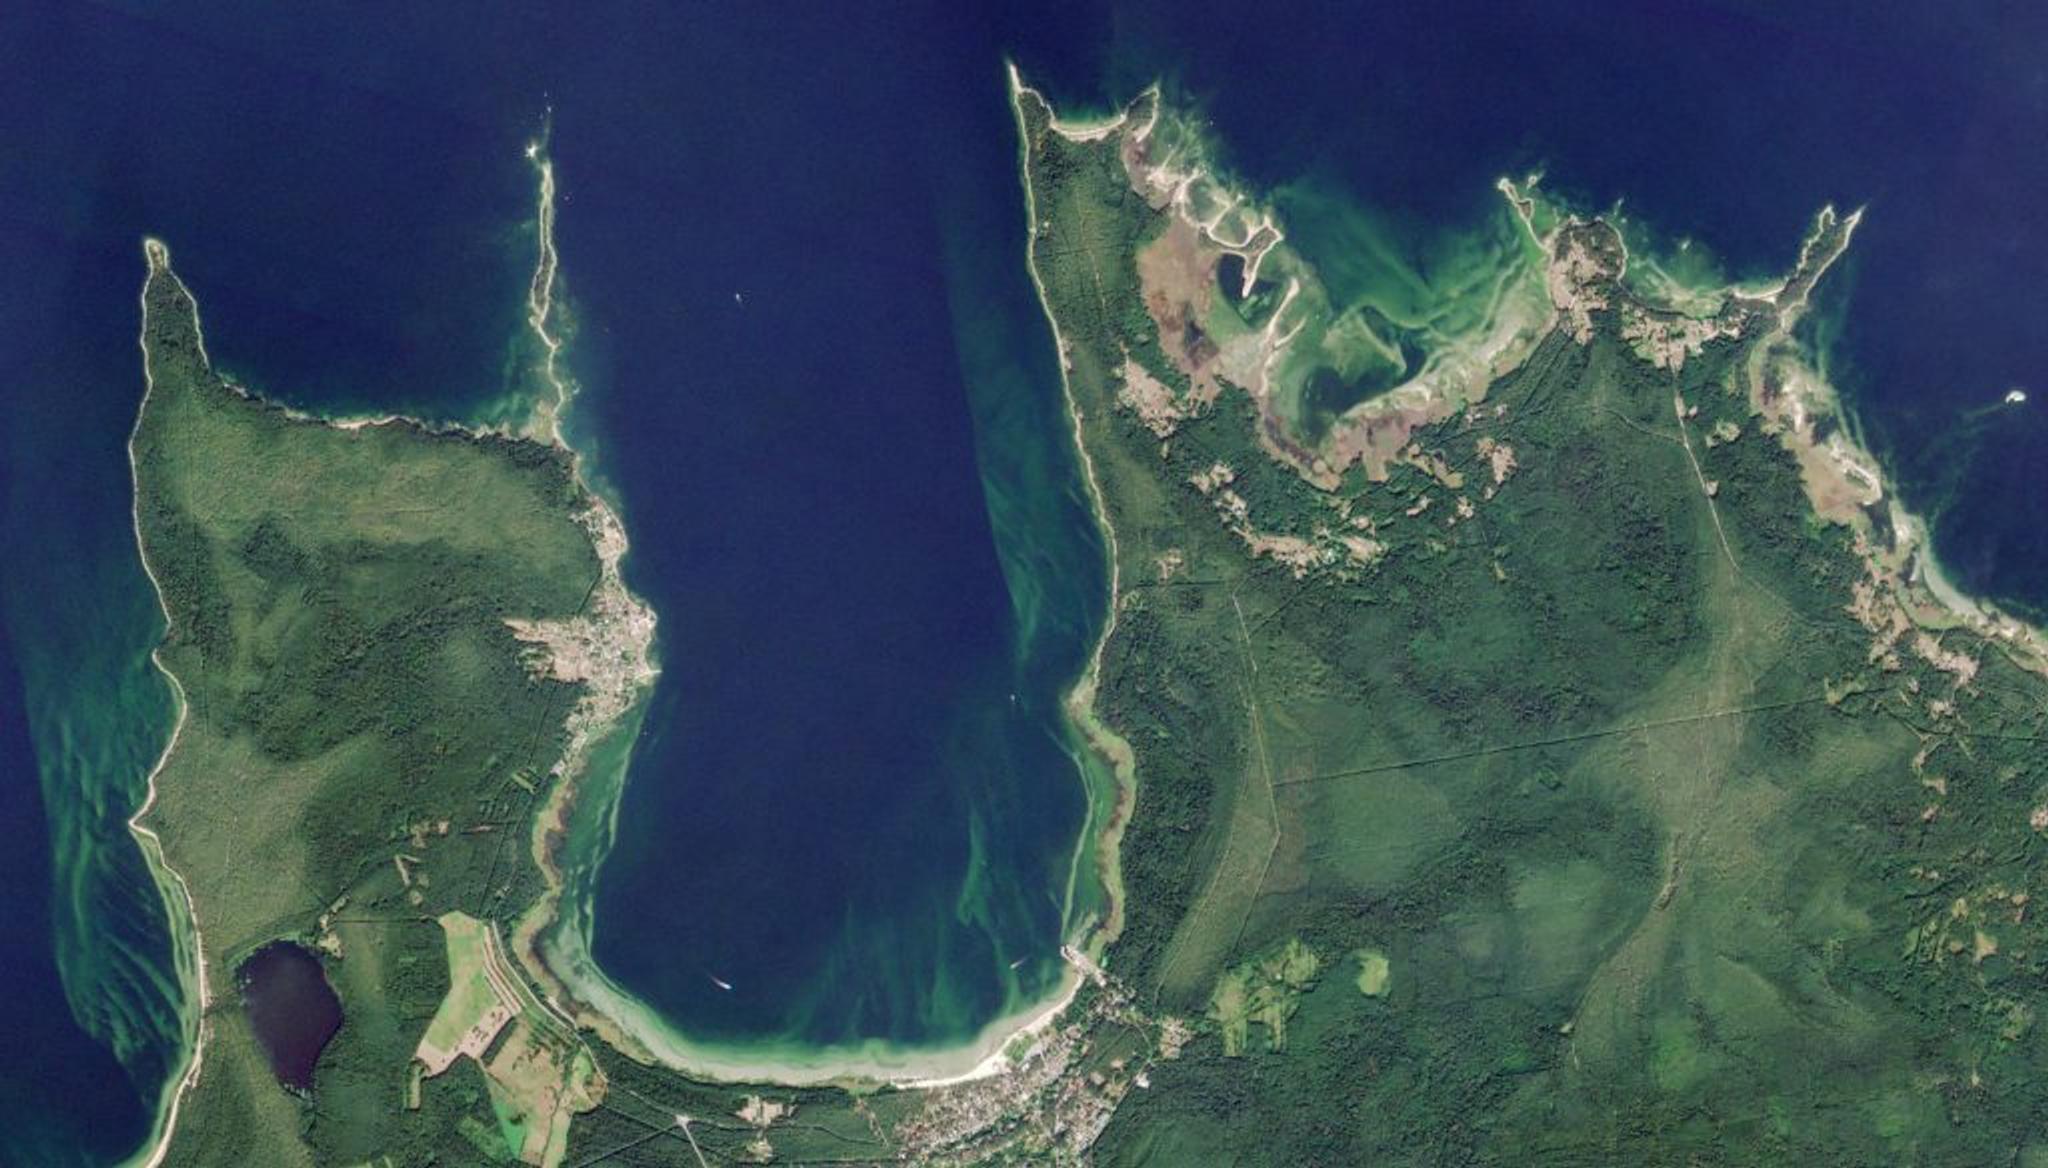
PlanetScope • Vainupea, Estonia • August 28, 2022
Satellite data helps researchers better understand the past, gain information on rapidly-changing present conditions, and uncover possible pathways for the future. They enable small teams to cover large areas, affordably monitor hazardous and far-flung reaches of the globe, and visualize the formerly invisible (like methane emissions). And despite the broad range of applications we shared here, these examples only scratch the surface of what’s possible.
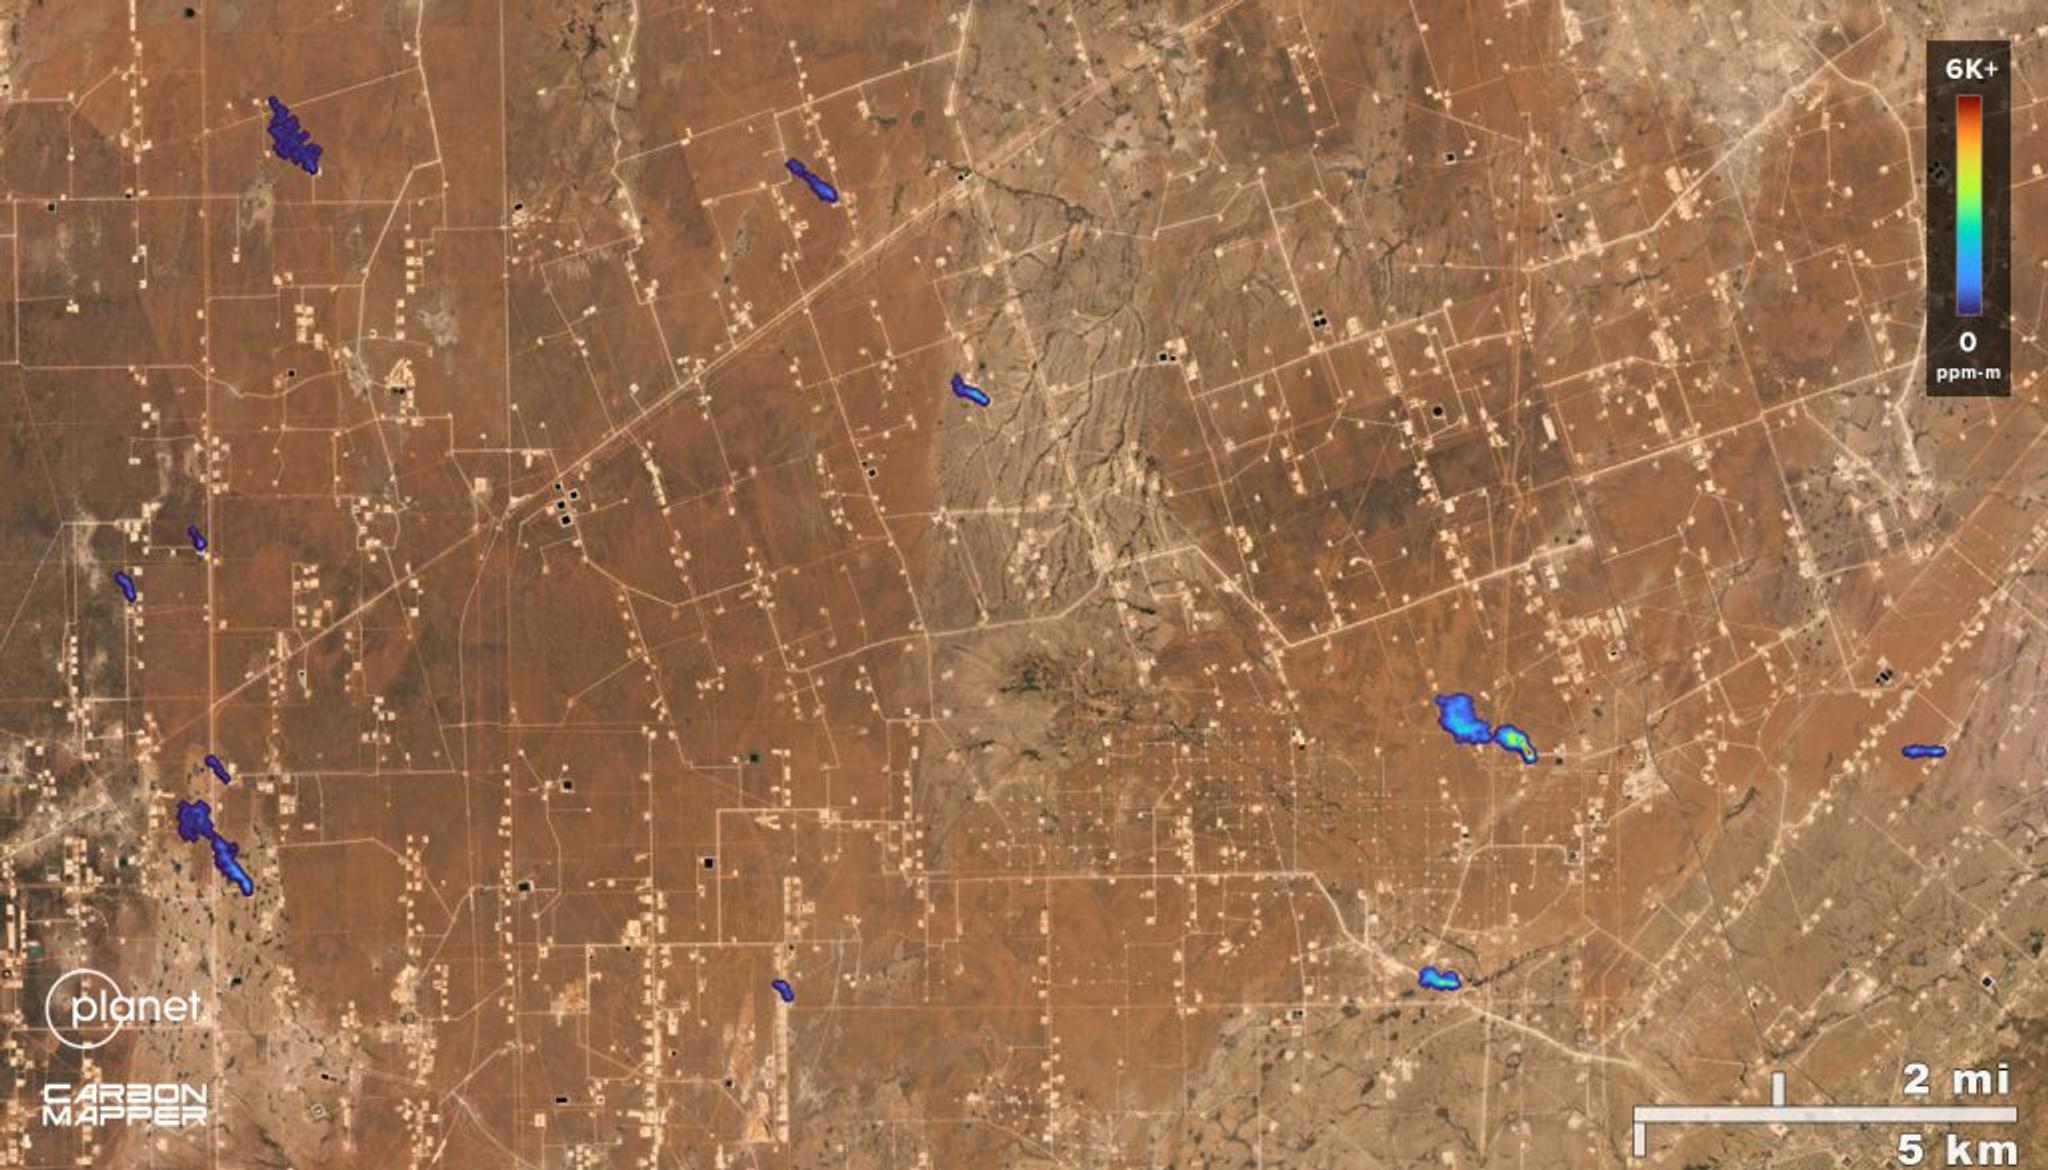
Methane plumes in the Permian Basin, Carbon Mapper & Planet Labs

Ready to Get Started
Connect with a member of our Sales team. We'll help you find the right products and pricing for your needs.

