
Working Toward Planetary Scale Location Insights
Recent innovations in agile aerospace have created unique offerings in high cadence satellite imagery. While this is of immense interest to imagery analysts, a significant portion of GIS professionals and geo-data scientists work less with raster data (AKA imagery) and more with point and vector data. Planet operates the world’s largest constellation of earth observation satellites providing near-daily coverage of the entirety of Earth’s landmass. Over the past couple of years, we have been working on bringing computer vision and spatiotemporal analysis to market to enable access and data transformations on this rich imagery archive. We recently announced the general availability of our analytic feeds and the launch of our building change detection analytics in private beta (sign up for info here). In this article, I will describe the process of using machine learning and automation for the purposes of going from satellite imagery (raster) to vector data. This results in data usable by geo-data scientists to explore and serve business insights. I will also aim to showcase a few specific technical capabilities that currently put this process into practice.
Data Transformations: Getting to Vector Data
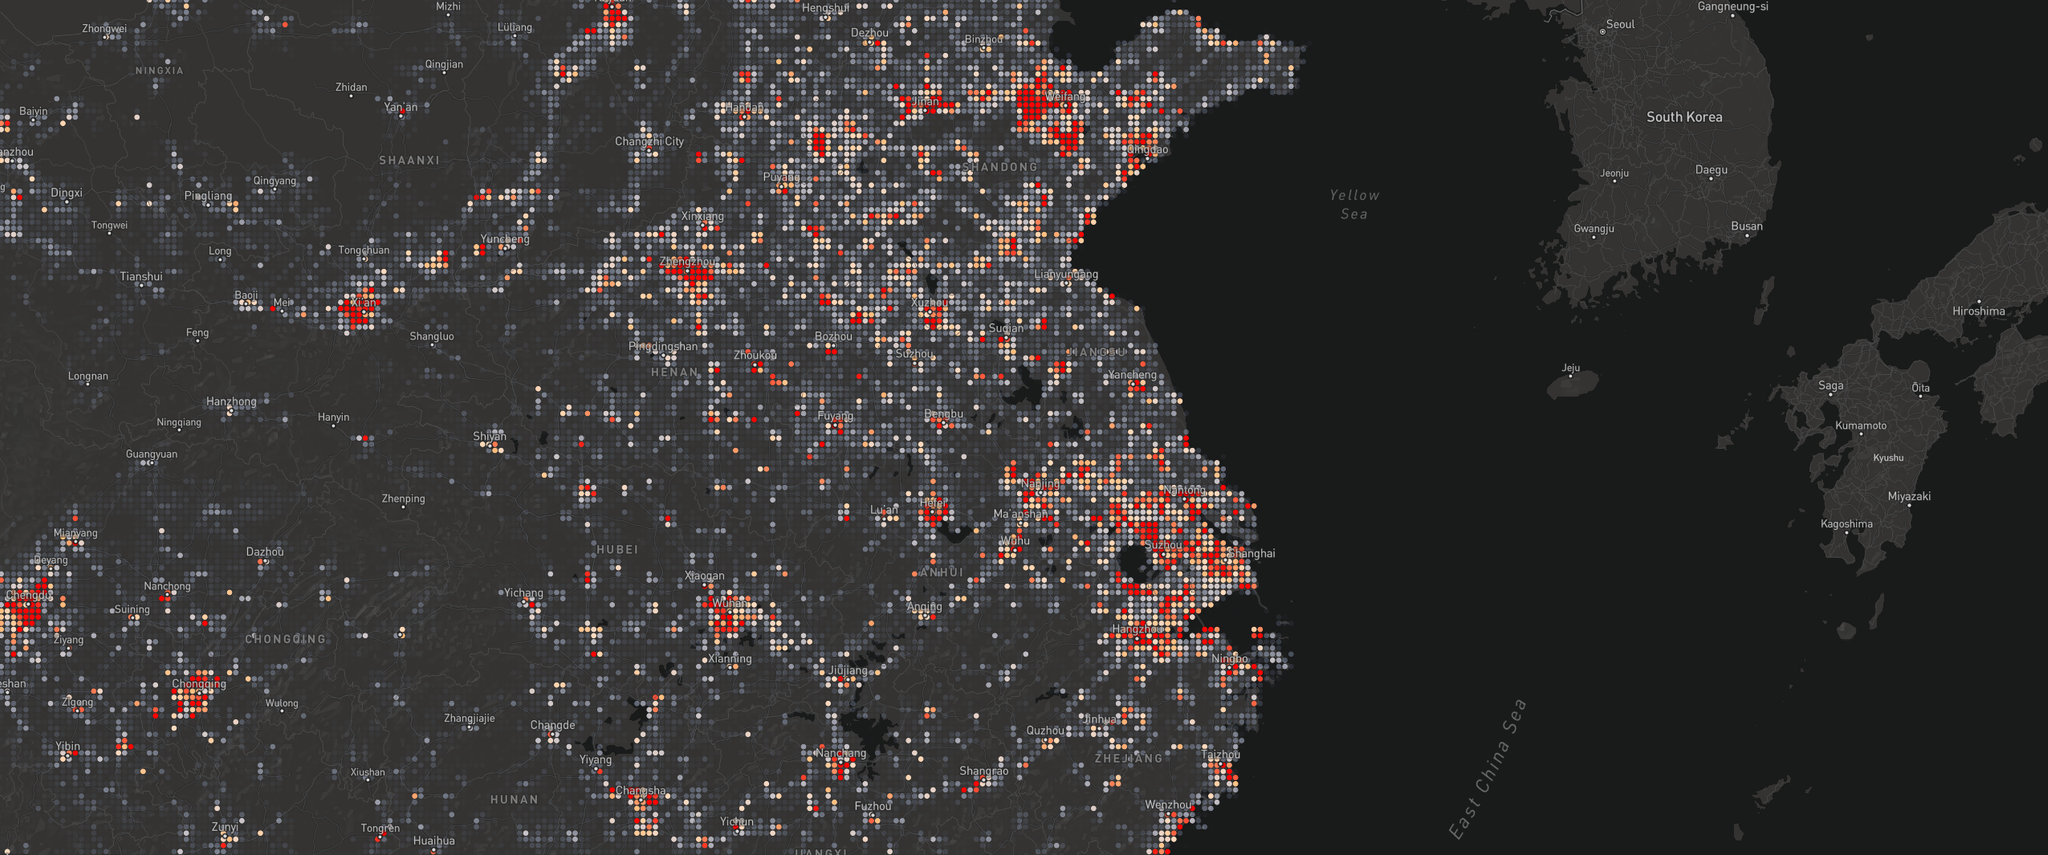
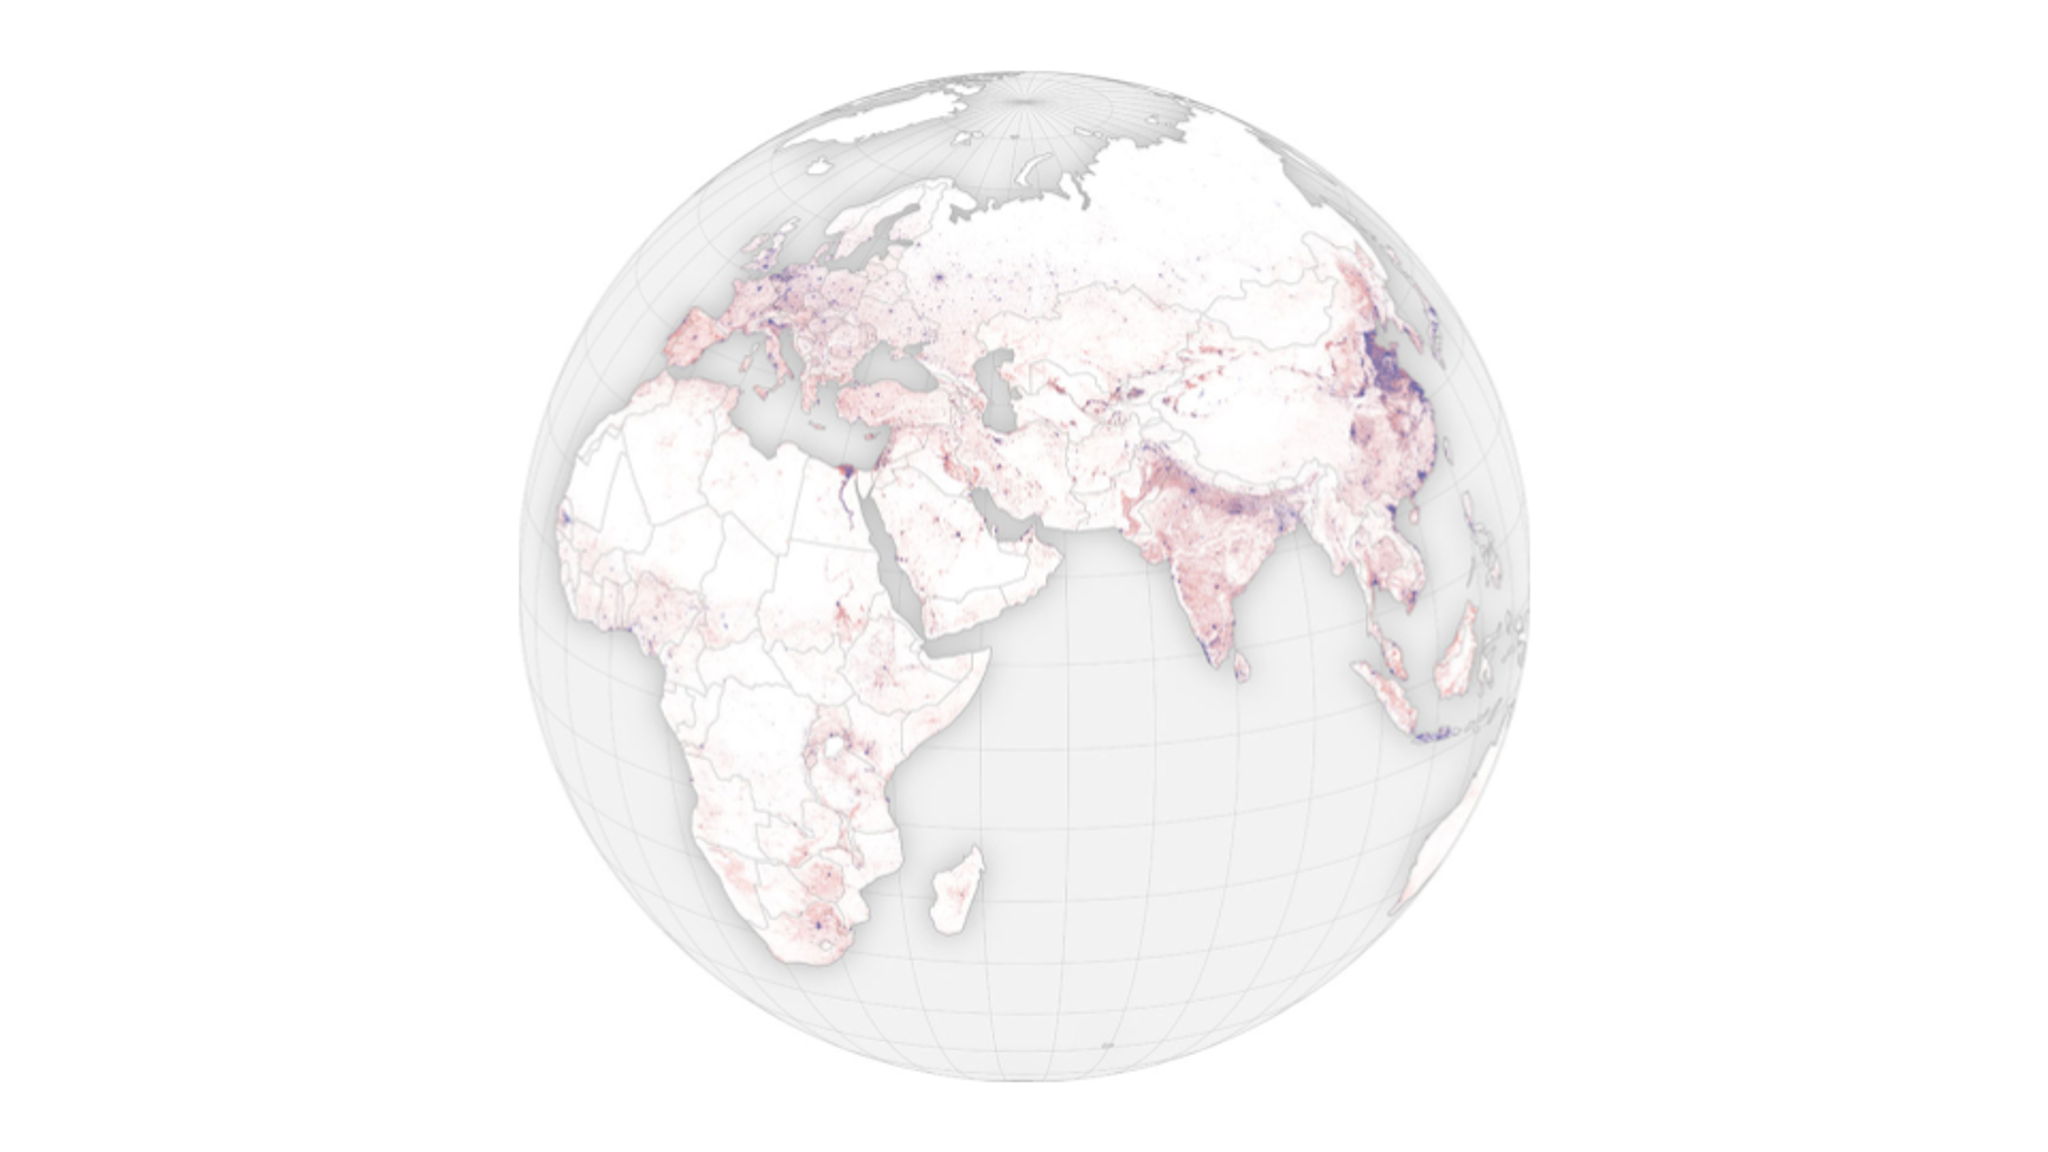
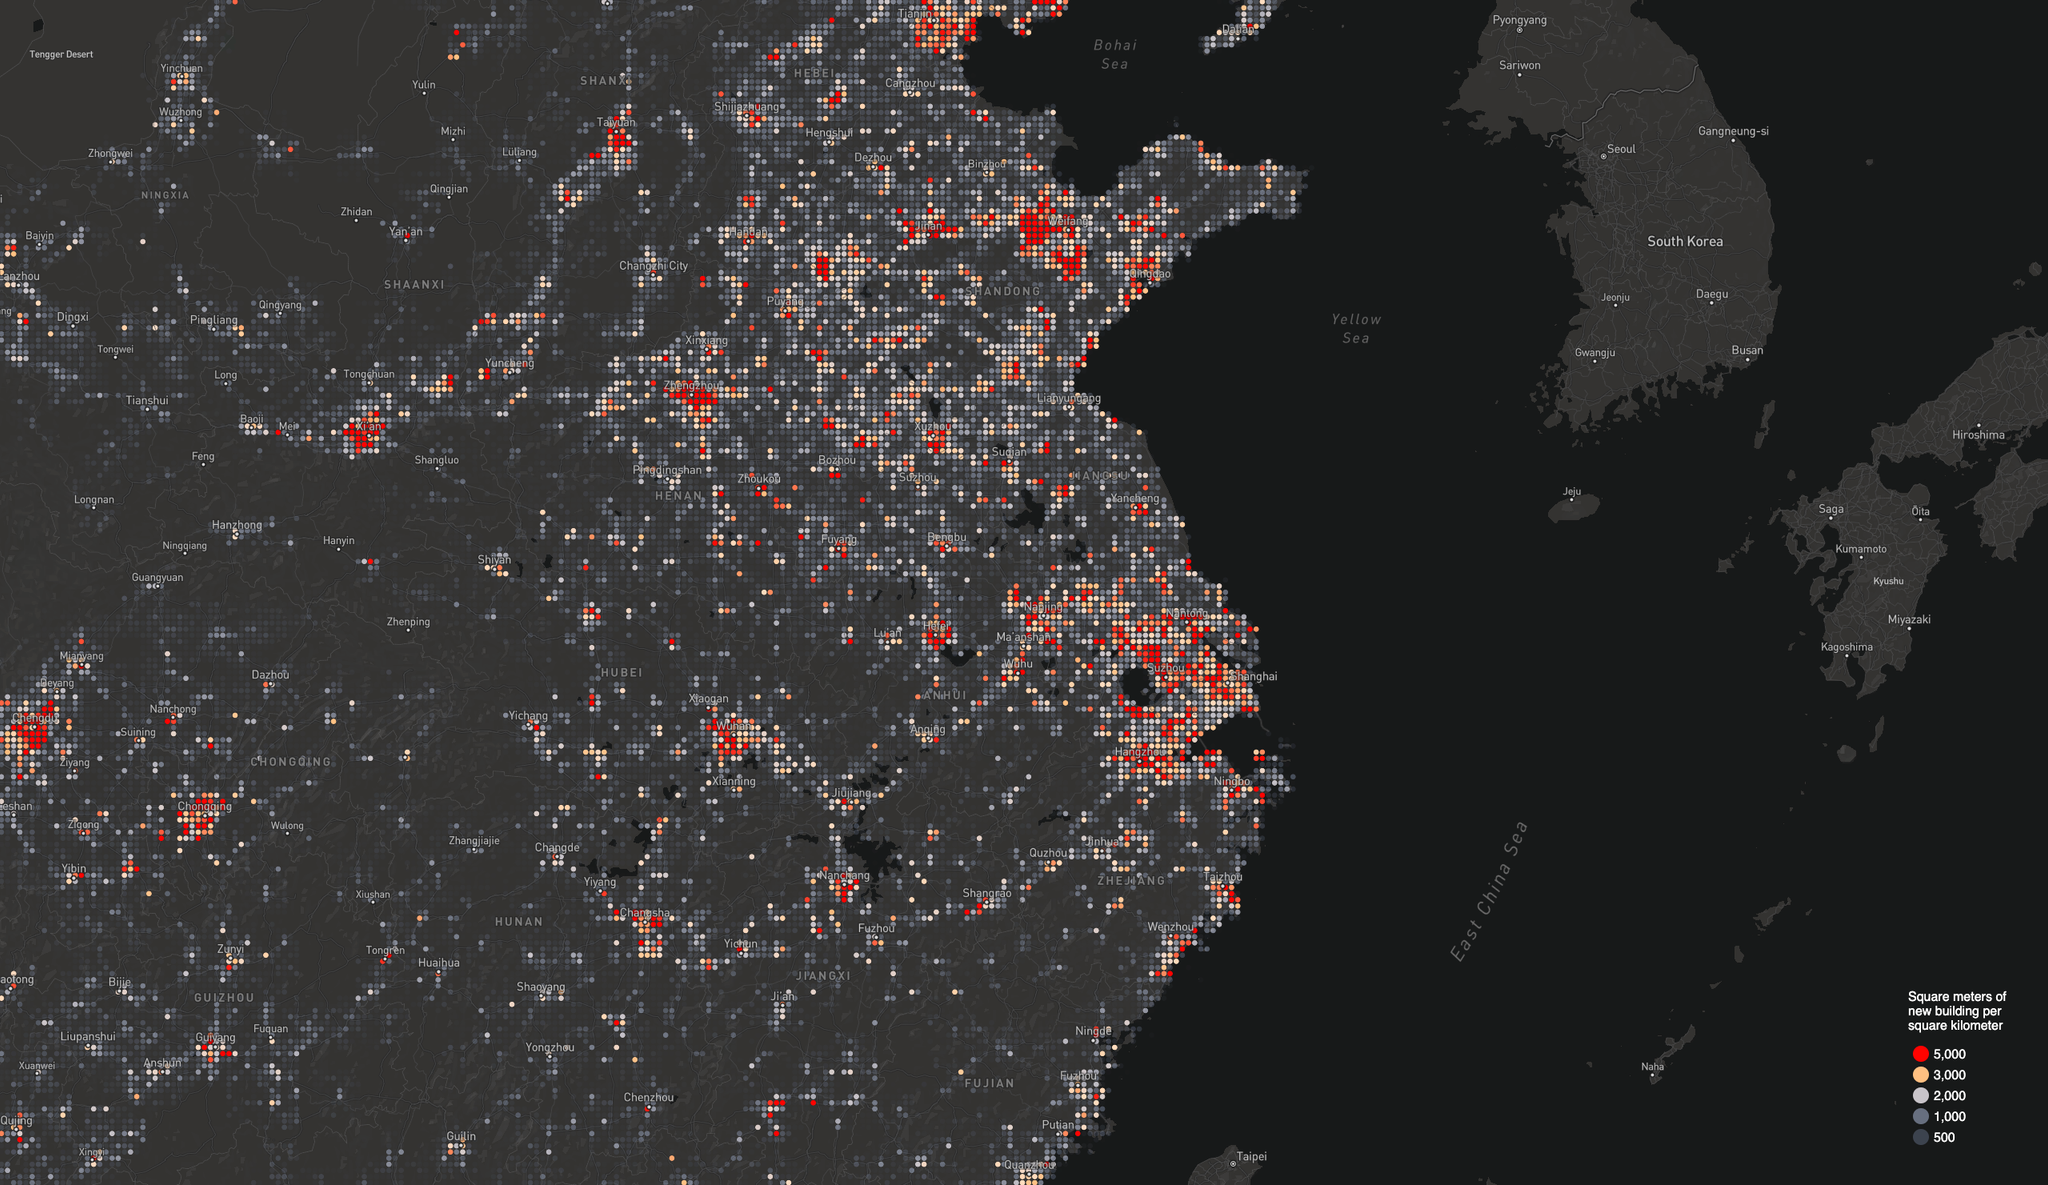
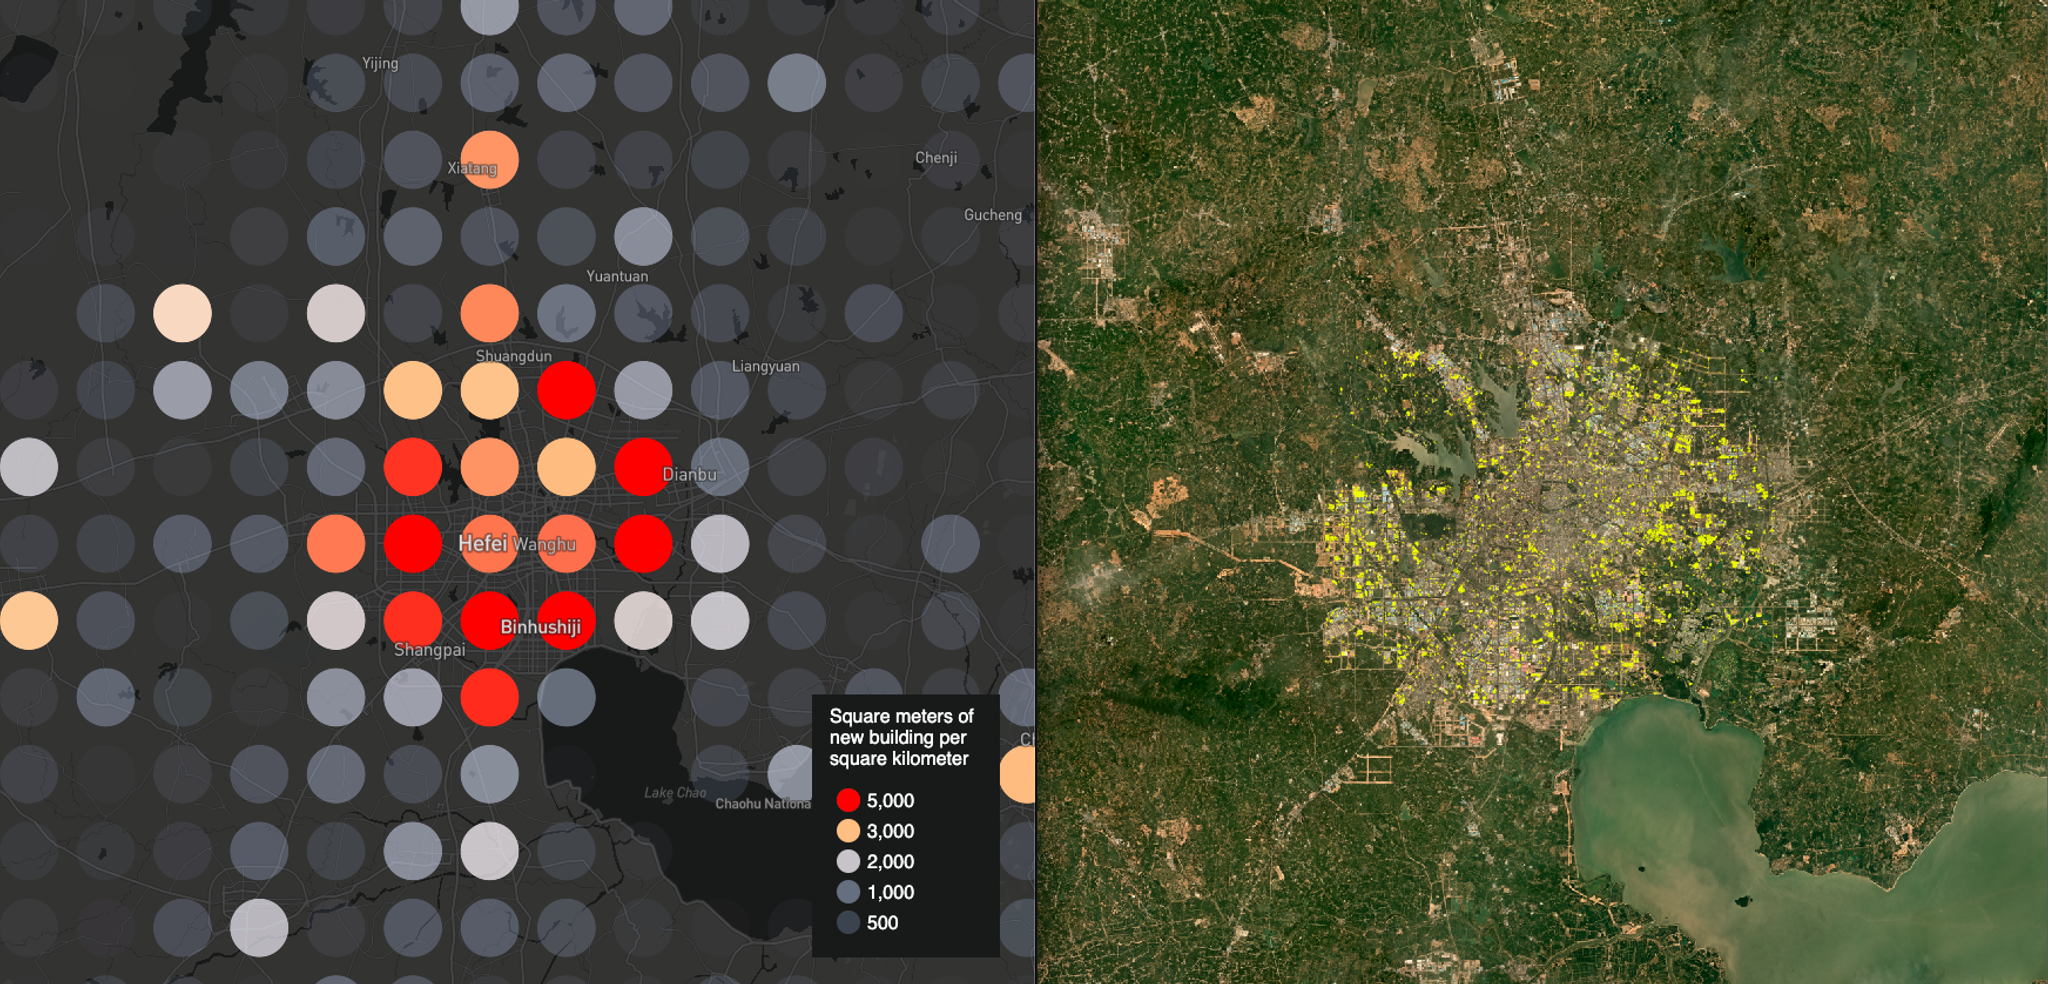
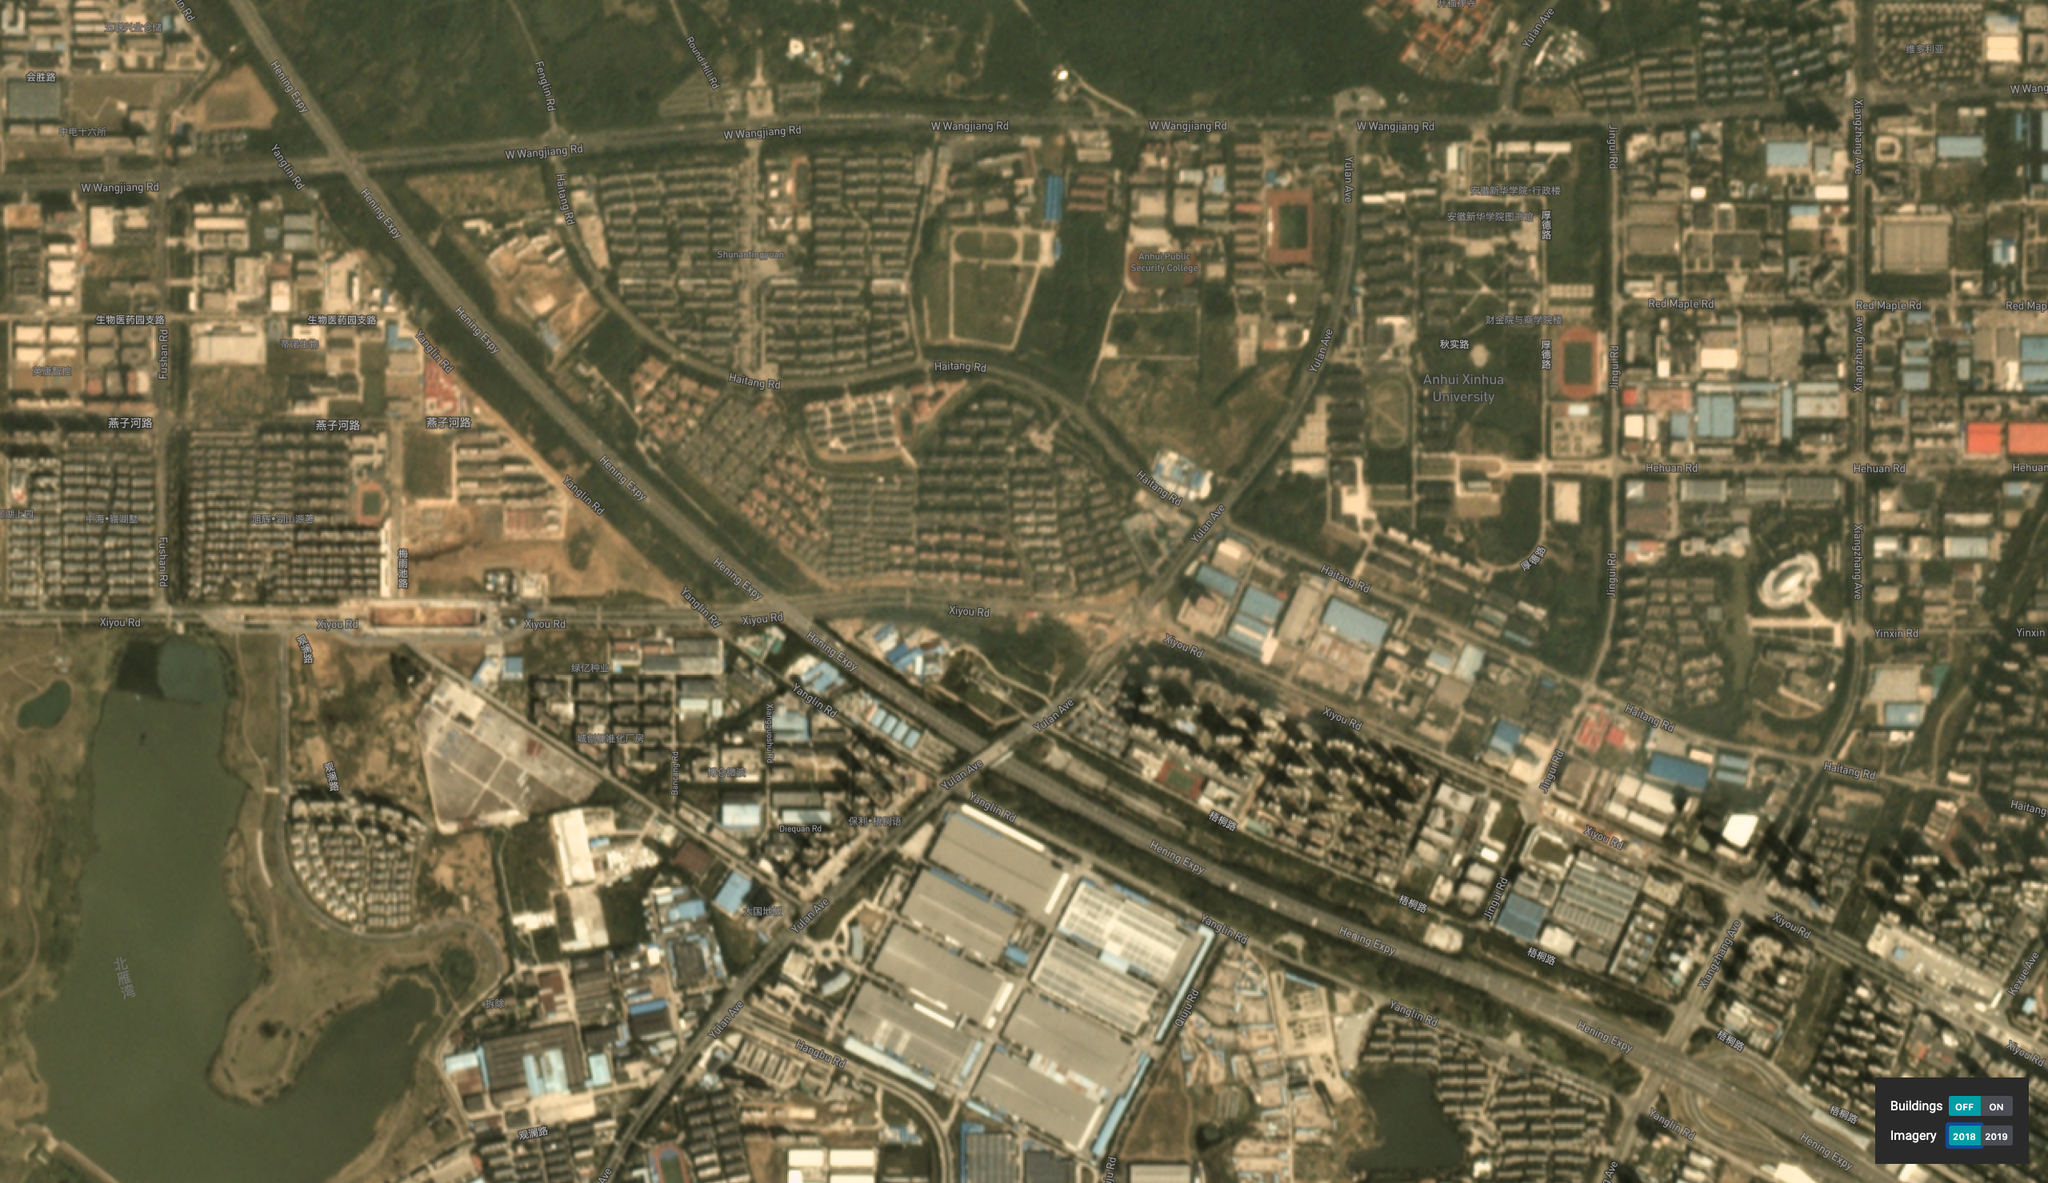
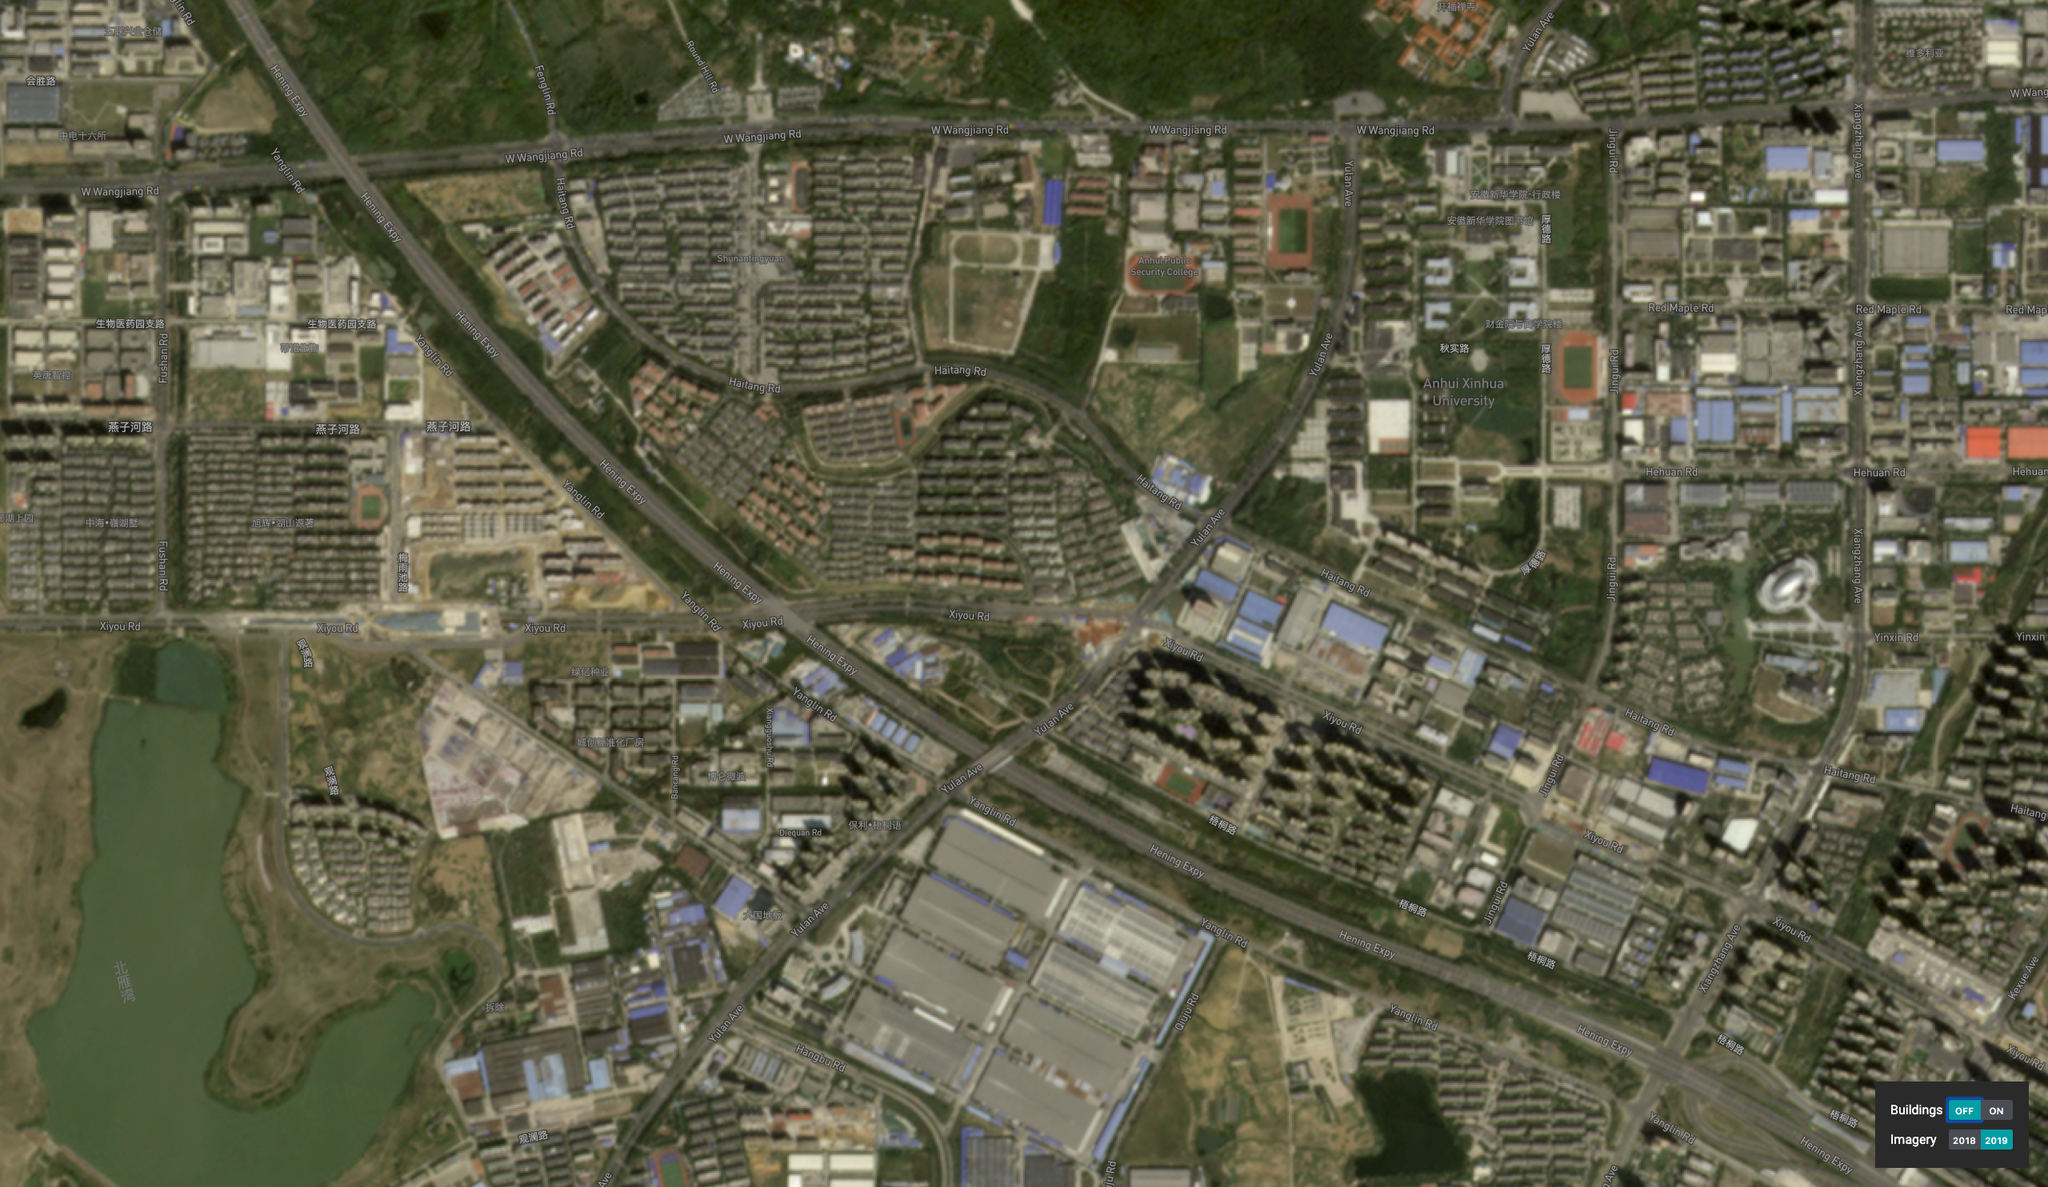
Roads and buildings constitute a class of features in satellite imagery that are resolved effectively and discernible at 3-6m resolution. By using modern advances in supervised learning, with access to archived global imagery, one can create building extraction capabilities that are performant across varying terrain, environmental conditions and surface context. One such product capability is the road and building detection as a service, served at monthly cadence from Planet, called Planet Analytics Feeds. Earlier this year, we mapped all of the world’s roads and buildings using this capability. You can read more about the effort here. [caption id="attachment_144183" align="aligncenter" width="960"]
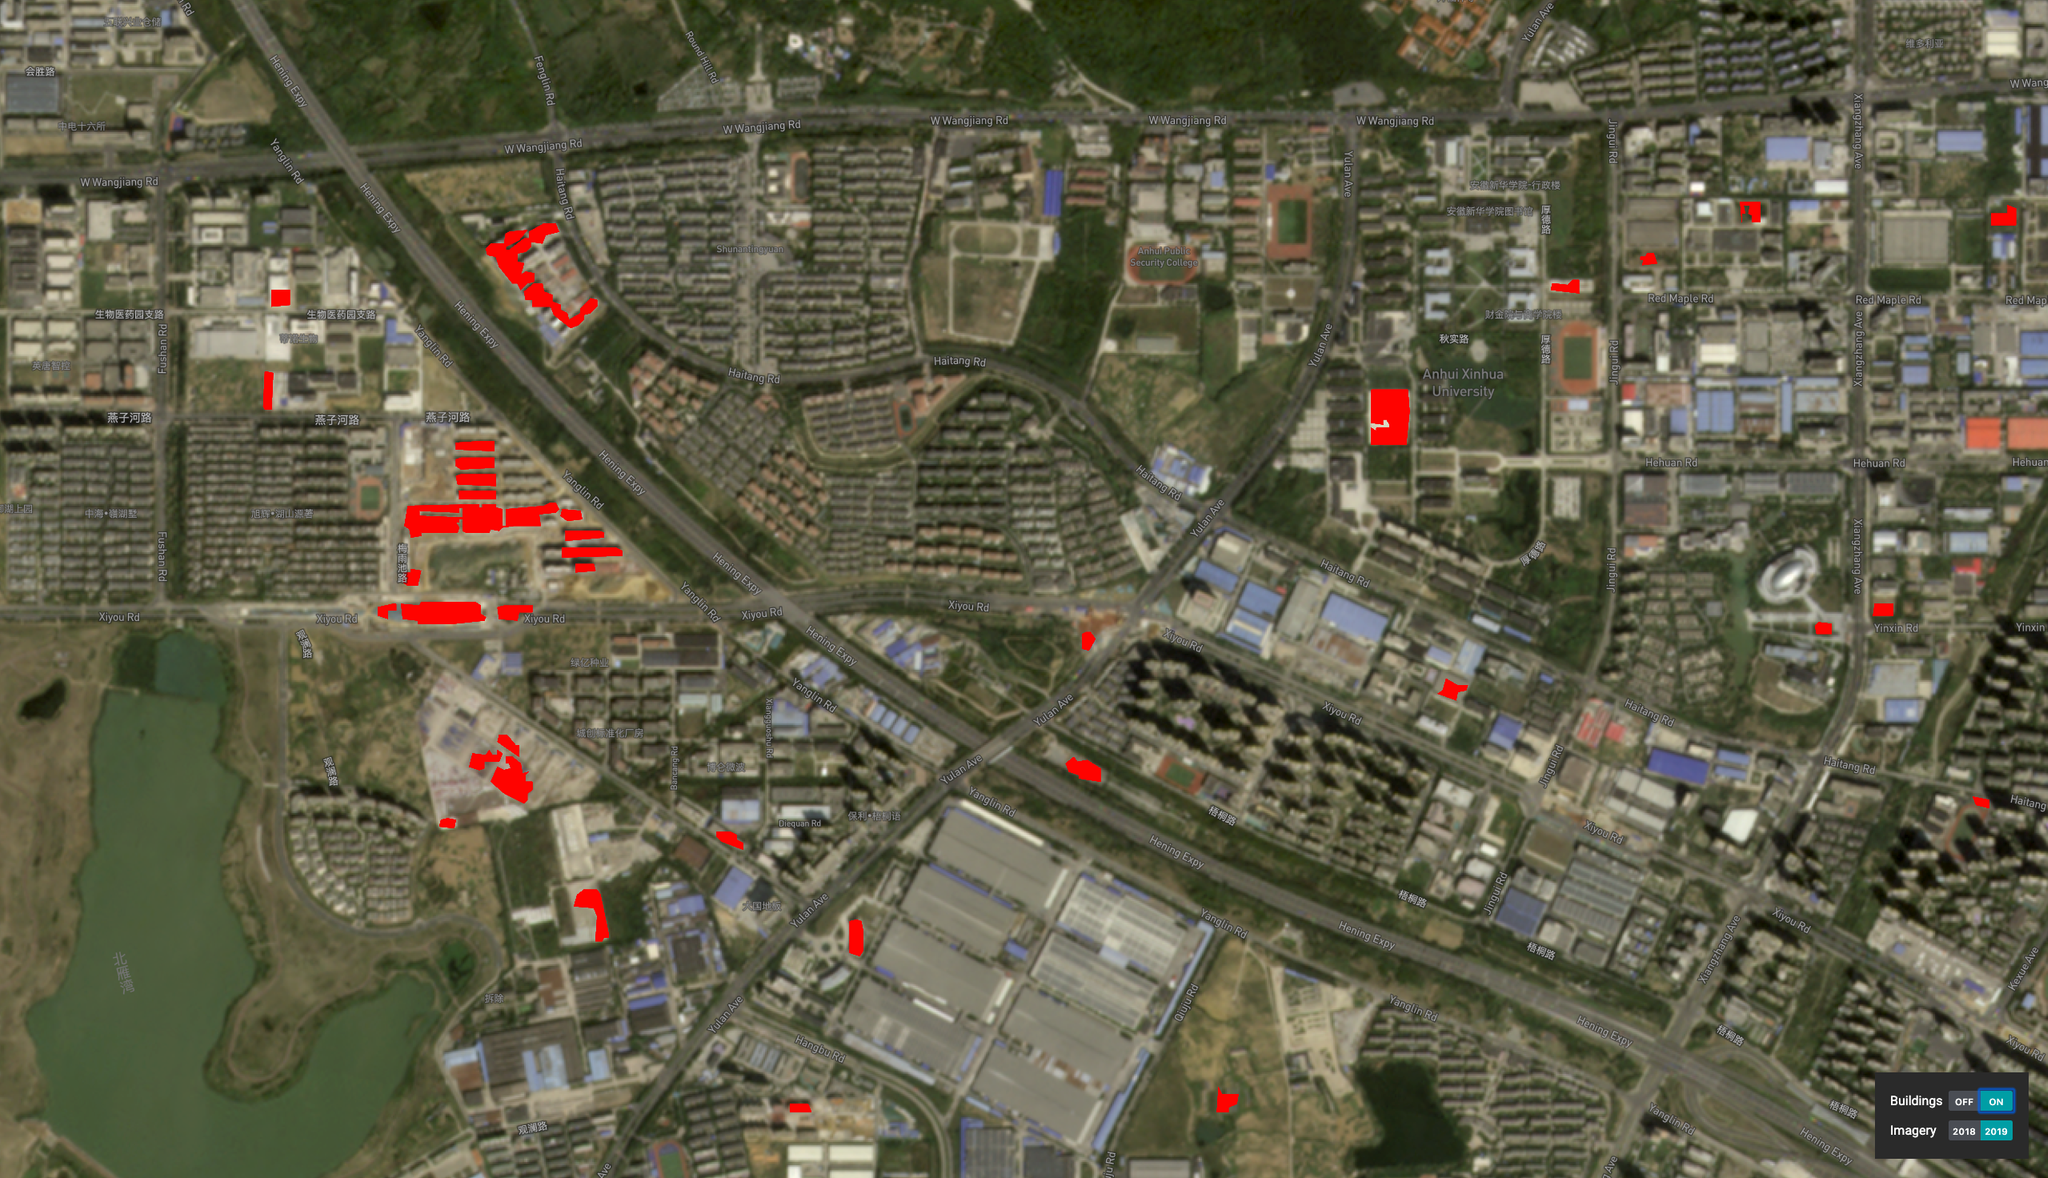
Going from Spatial Feeds to Location Insights
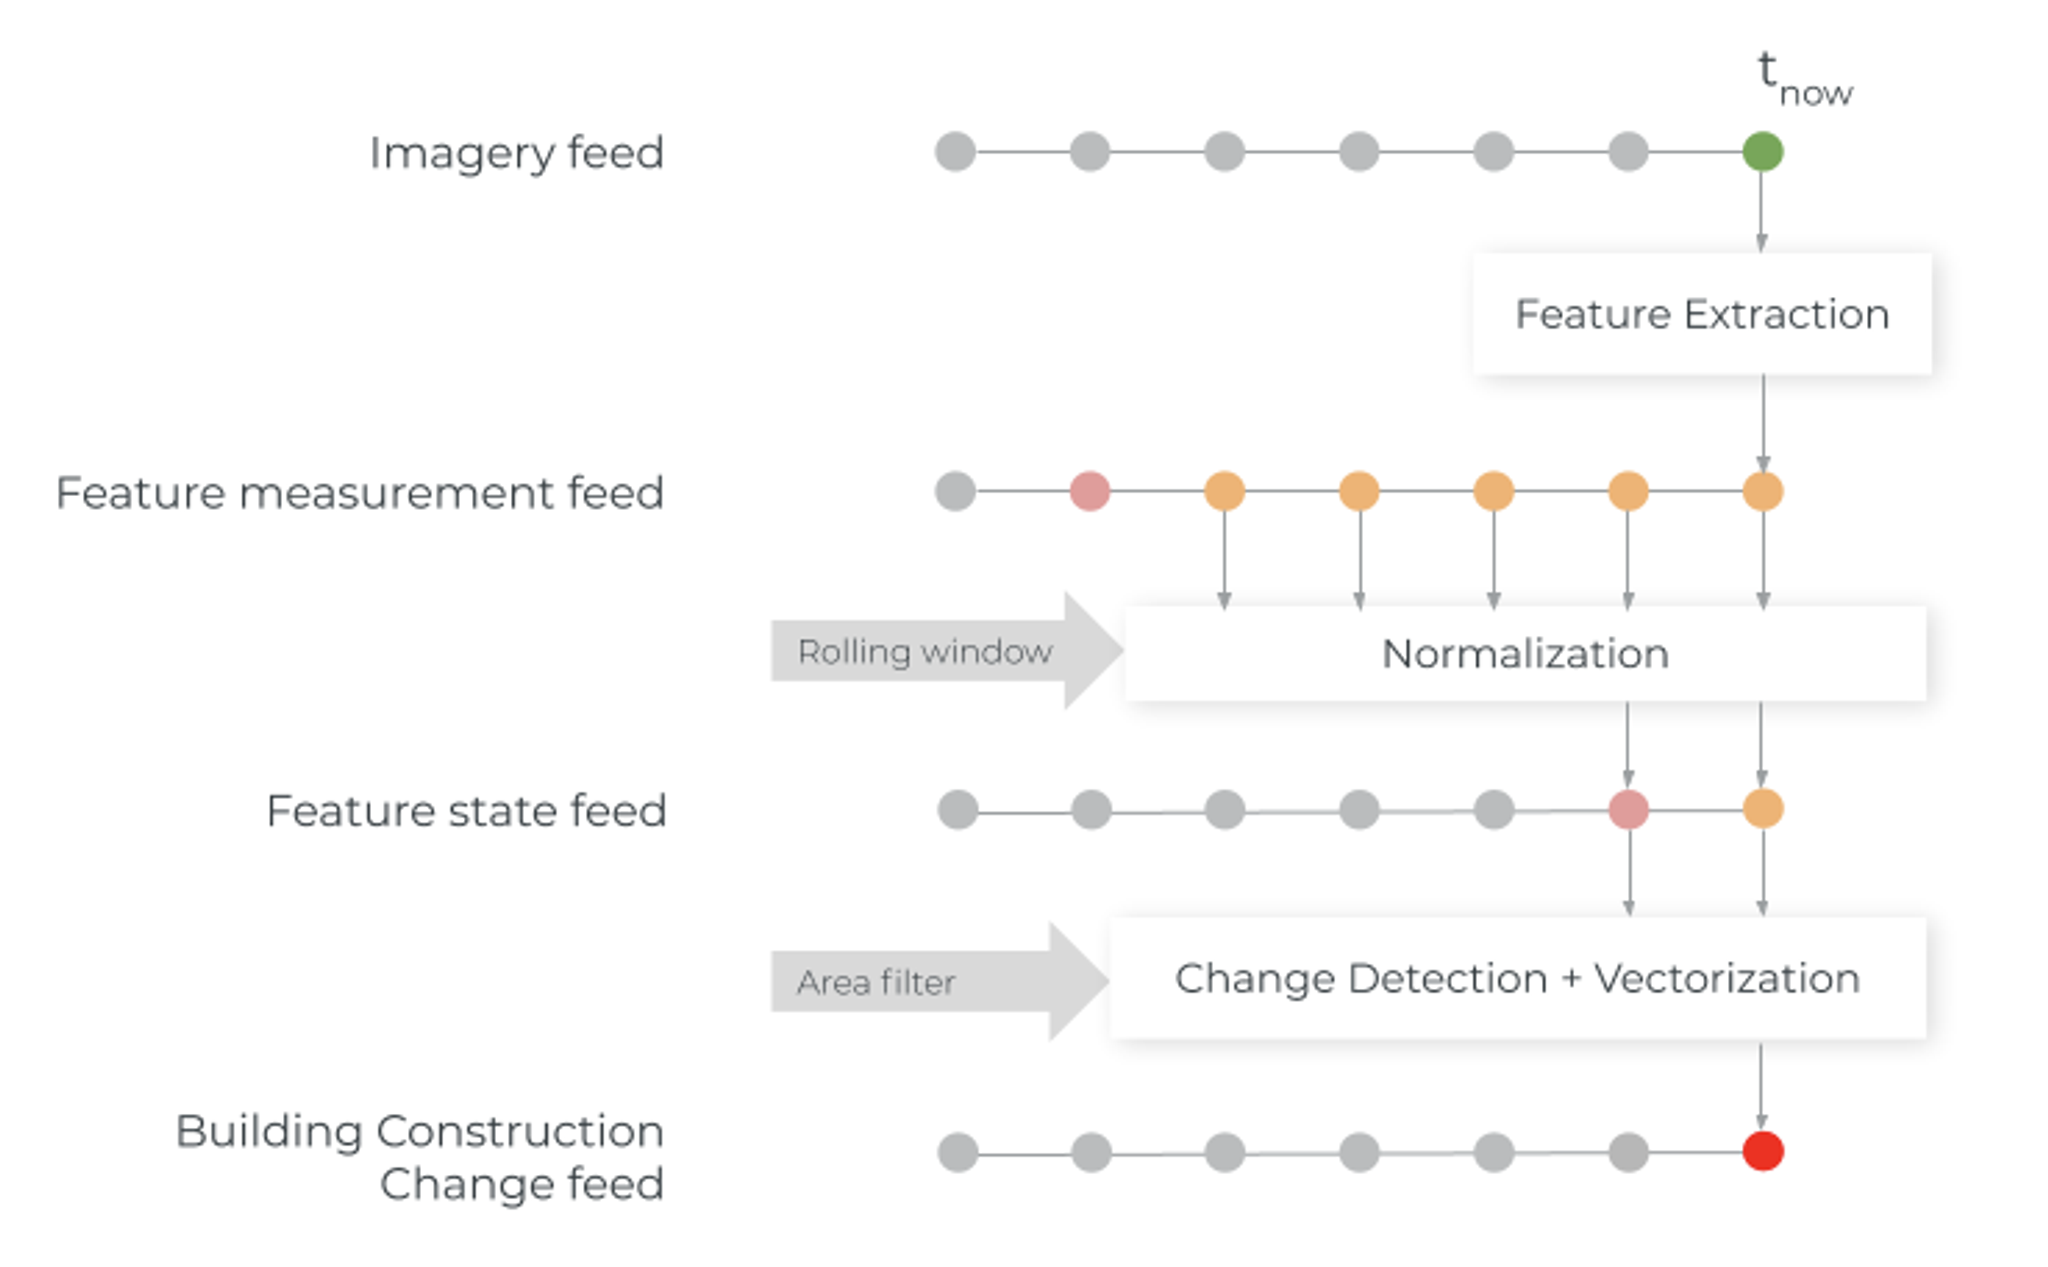
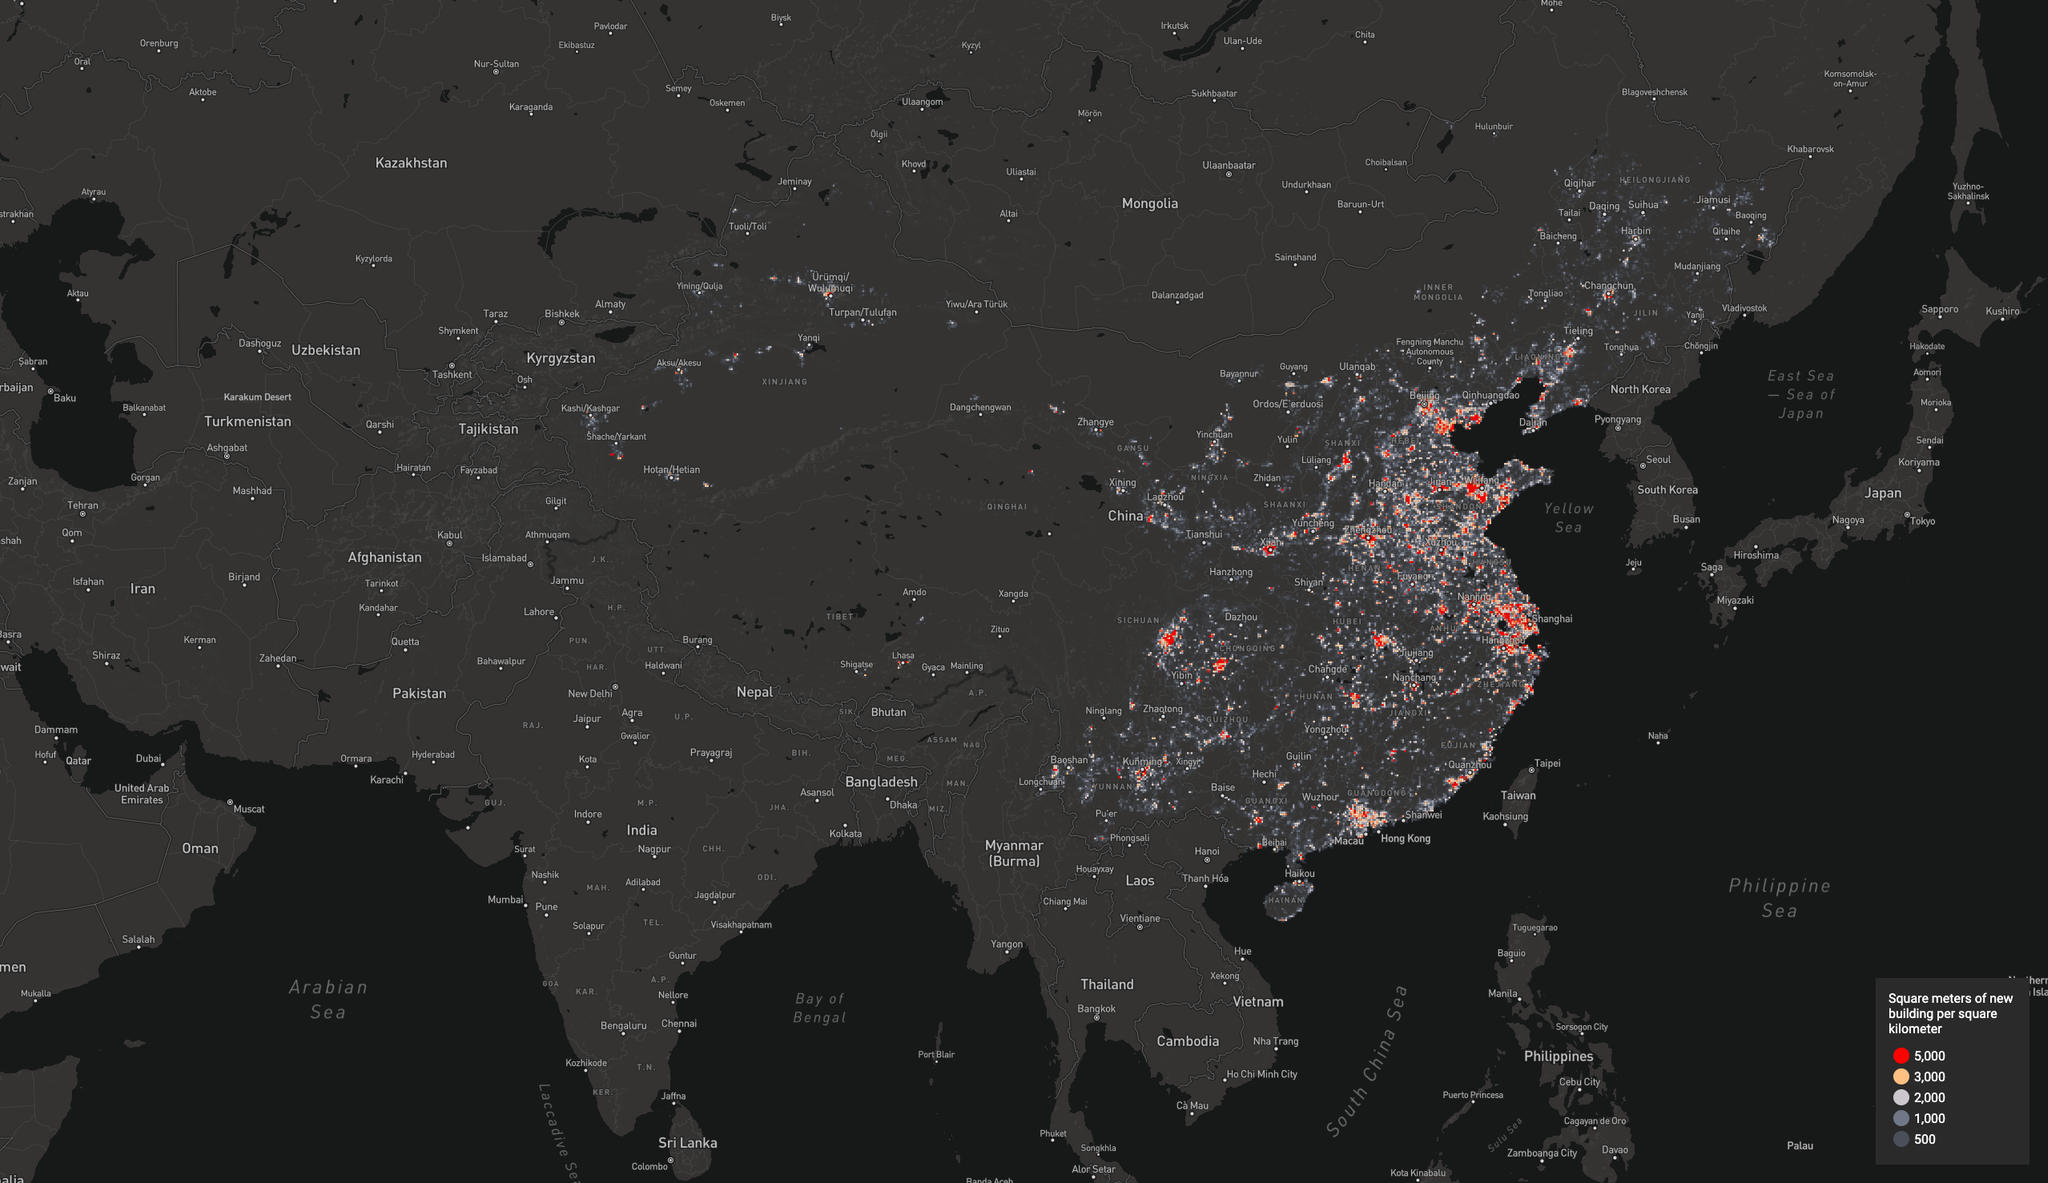
The above methods get us from imagery to a vectorized change feed, serving geospatial change information aggregated to a regular cadence. This is one of the collection of commercial and public feeds used by geo-data scientists to generate actionable insights. This data can be effortlessly imported to a geopandas dataframe and analyzed using open source data analysis tools in python and R. A building detection change feed can be used to monitor macroeconomic trends within villages, cities and countries. It can be used to track sustainable development using measures of land consumption rate. I’ll be walking through a few examples of geospatial data exploration at a training workshop session at the Open Data Science Conference (ODSC2019) on November 1st in San Francisco. If geospatial imagery, geodata streams and spatial insights are of interest to you, reach out to me at gopal@planet.com and I hope to see you there!
Ready to Get Started
Connect with a member of our Sales team. We'll help you find the right products and pricing for your needs